Market Volatility Ratio
Chart Last Updated: January 01 1970

To see key chart levels click here.
Category: Sentiment
Description:
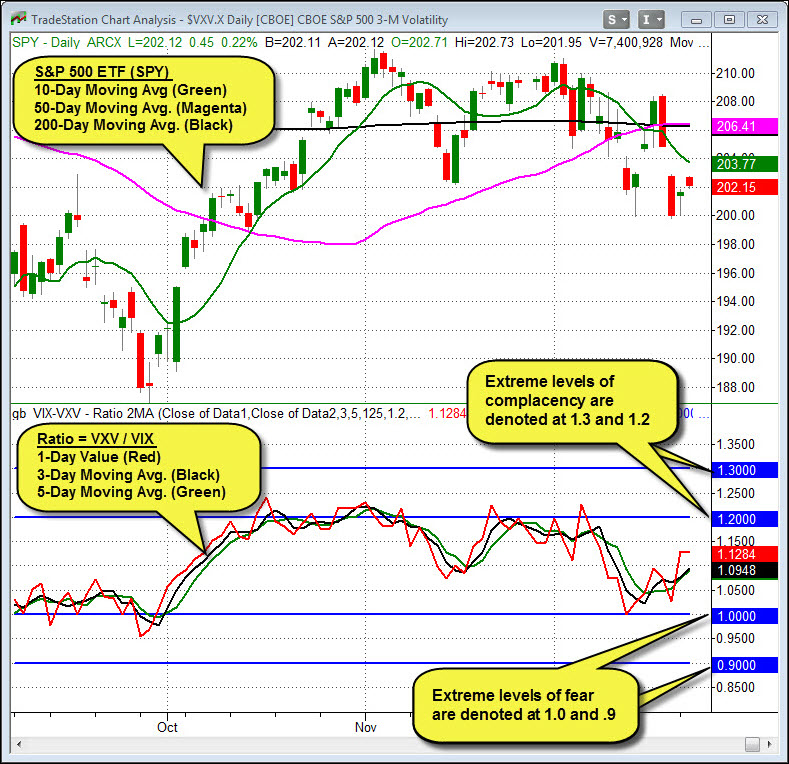
This sentiment indicator measures the ratio between the short-term volatility index (VIX) that measures a 1-month time frame, and an intermediate-term volatility index (VXV) that measures a 3-month time frame.
The formula for the ratio is (VIX / VXV).
This chart tracks the 1-day (red) value, 10-day (black) average of this ratio.
How to Use:
The moving average smooths the data and illustrate more sustained periods of potential extreme volatility.The chart has excessively bullish thresholds of 1.2 and 1.3., and excessively bearish levels of 1.0 and .90. When sentiment becomes excessive the market tends to reverse direction.
However, because sentiment can continue to trend beyond these levels, we look for these measures to exceed and then cross back below these levels before confirming a reversal.
The strongest signal occurs when both measures (1, and 10 day Moving Average) exceed the thresholds and reverse.