Percentage of Stocks Over 10, 50, and 200 MA
Chart Last Updated: January 01 1970

To see key chart levels click here.
Category: Sentiment
Description:
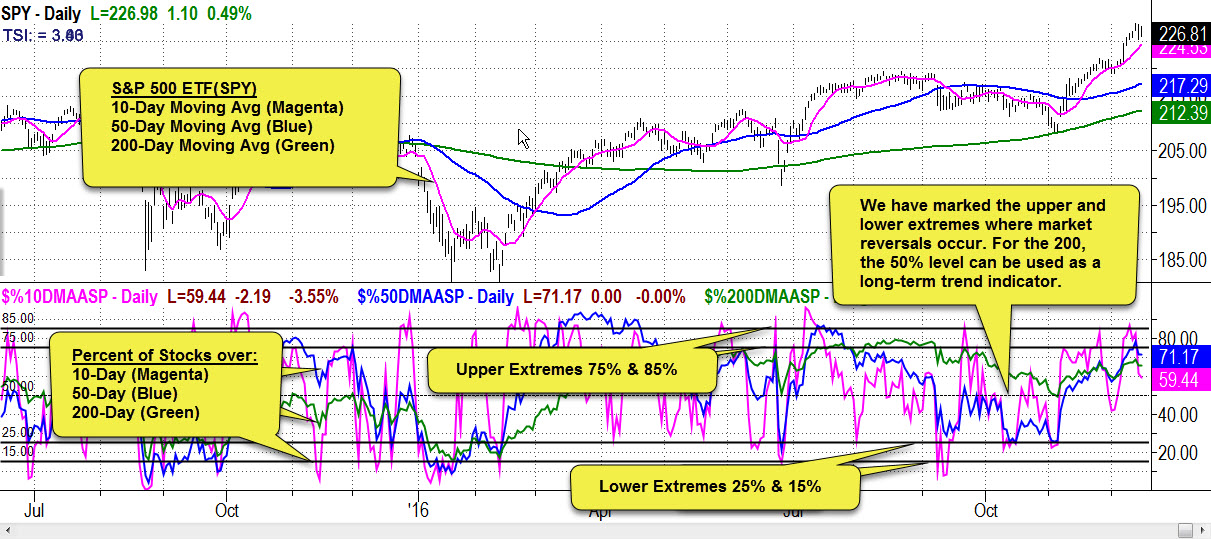
This indicator tracks the percentage of NYSE stocks over their 10, 50, and 200-day moving averages. The stocks over the 10-day moving average is represented by the magenta live. A value of 90% indicates 90% of stocks above and a value of 10% indicates 10% of stocks above the moving average. The blue line represents stocks above the 50-day moving average. The green line represents stocks above the 200-day moving average. The 10-day, with its much shorter period, tends to be considerably more volatile than the two day and can very quickly switch between extremes.
How to Use:
We have marked the 75% and 85% as upper extreme levels and 25% and 15% as lower extreme levels. Movements off of these extreme levels represent possible market reversals on shorter and longer timeframes depending on which moving average length is considered. For short term traders the % of stocks over 10 day moving average can be used an overbought/oversold indicator