March 5, 2023
Weekly Market Outlook
By Keith Schneider

After 4 weeks of consecutive, albeit small, negative performance weeks for most of the major indices (IWM-Small Caps were positive last week), we finally got a positive week fueled by two up days in the S&P 500, the Dow, the NASDAQ 100, and Small and Midcap stocks.
It was nice seeing the positive bias the past two days.
The past few weeks in Market Outlook, we shared with you that the back half of February, on a seasonal basis, is usually negative. I wondered if February acts like this because a) earnings are coming in and can often fall short of expectations; b) February is the least exciting and shortest month of the year; and c) it is the middle to end of Winter and people are starting to feel the lack of sun and are trudging through a period of colder, uncertain weather. Many like myself, are starting to get sick of spending more days indoors.
Whatever the reason(s), 2023 lived up to the historical February expectations and this seasonal pronouncement.
Many of the economic, market, and sentiment readings, however, remain murky and continue to be mired in uncertainty. Can the Fed bring down inflation? Will they raise 2 or 3 more times? When might they pivot? Will the numerous Fed hikes made during 2022 and early 2023 begin to kick in? When might we see the signs of a “real slowdown” or a possible mild or severe recession?
Great questions and we don’t have all the answers. Mish and the rest of us believe, however, that we are in for CHOPPY markets, stagflation, and no pivot from the Fed, at least not anytime soon.
But that doesn’t mean you won’t have multi-day or several week rallies, usually met with consolidation and/or drifting sideways or down as the market tries to find some meaningful reason for a positive bias.
The recent market weakness was fueled, in part, by the belief that the Fed would once again become more hawkish and raise by 50 bp. This week’s bullish spark, at least short-term, was ignited by Atlanta Fed Governor Bostic suggesting that even with higher inflation (see our Market Outlook commentary last week), the Fed was likely to only raise by 25 basis points at the upcoming March Fed meeting. This was welcome news after the past few weeks of hotter than expected CPI, PPI, and PCE numbers.
AAII Bullish-Bearish Indicators
We have frequently used the bullish/bearish readings published weekly/monthly by the American Association of Individual Investors (AAII) as good “retail” indicators of what individual investors are thinking and doing with their investments.
We have also pointed out several times on these pages when these indicators get overly bullish or bearish.
For us, these charts can serve as a contrarian indicator. That is exactly what occurred this past week as the AAII indicators got quite bearish yet again. We provide the following positive/negative AAII charts as evidence of the recent fast changing investor sentiment.
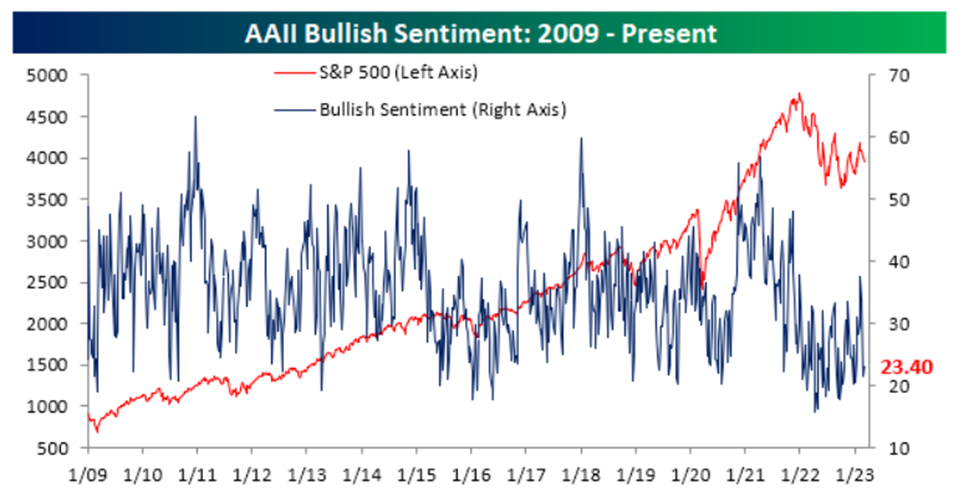
Bullish sentiment dipped back down to 23.4. It revisited an area that it last saw late last year.
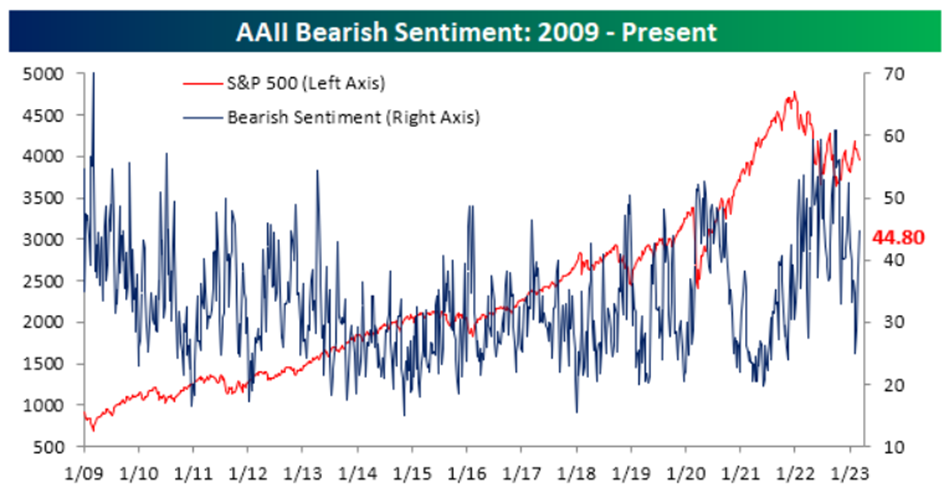
Bearish sentiment rose to an area it saw several times last year, especially late in 2022.

After trending up since late last year (positive) the sentiment reading headed south quickly, suggesting a negative sentiment was (once again) affecting the market.

This could have been the contrarian indicator that was needed to pull the market out of its recent malaise.
-
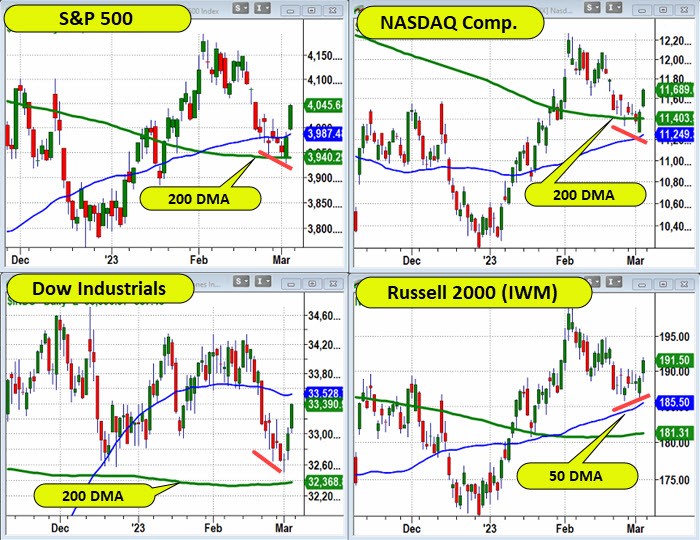
Bearish Sentiment vs. The 200-Day Moving Average

At MarketGauge we take the critical moving averages seriously. So we had a critical eye on the 200-day moving averages this week. As you can see in the charts below, the area of the 200-day (green line) withstood several tests in multiple indexes.
Additionally, as we’ve mentioned here over the last several weeks, the small caps, represented by the Russell 200 ETF (IWM), has demonstrated notable relative strength recently. The charts below also illustrate how the IWM (lower right chart) didn’t pull back to its 200-day, and last Thursday, it didn’t make the same low for the recent move as the other three indexes.
-
Big Resistance Above
Mish likes to watch the 23-month moving average. It represents the two-year economic/business cycle, a very important and telling cycle.
Recently, on her National TV appearances, she has suggested it might be very hard for the S&P 500 to rise above 4200 as that is the approximate 23 month moving average. (actually with time it has come down slightly to 4140). Watch that area as resistance or a potential upward confirmation. See chart below:

In fact, she has often suggested that the market could move sideways for a long period of time, oscillating between 3700 and 4200. As she puts it so eloquently, “this is what stagflation does to the markets.”
This kind of market action should be expected in the stock and bond markets when the Fed is raising rates, inflation is persistent, and geopolitical and budgetary headwinds exist.
I call it Chop City. When the markets are positive, others like to call it “The Grind.”

Some Seasonal Influences
I like to follow both Bulls and the Bears weekly to get their differing opinions. Furthermore, there are a few that I like to pull information from.
For example, our friends at Stock Traders Almanac (STA). I was a big fan of Yale Hirsch and his son Jeff has carried the torch forward with continuing great insights. This week they pointed out that as part of the best six-eight months, March has historically been a solid performing month for the major market indices (Dow, S&P 500, NASDAQ, and Russell 2000). These market indices advance more than 63% of the time with an approximately 1% or better gain for the S&P 500 during March.
That said, STA points out that March in pre-election years (i.e. 2023) performs even better. In pre-election, the month of March ranks 4th best. (January, April & December are better). And in these pre-election years, the DJIA in March has been up 14 of the last 15 times. See the chart below for more information on the DJIA and the other market indices.

If you have read these Market Outlooks with any regularity, you may be aware that one of my other favorite analysts is Ryan Detrick of the Carson Group (he used to be with LPL). Ryan points out that March 13th has been the day for the S&P 500 to bottom and come out of Bear markets. See the chart below:

This is a Trader’s Market
As noted above and in the past few weeks, there remains plenty of headwinds and uncertainty in the markets, especially in light of rising interest rates this past week. Recall that we suggested last week that if the 10-year Treasury Rates broke out of a channel and back to 4.0% it would likely cause some added pressure on the stock market (it did just that on Tuesday and Wednesday this past week).
At the moment, it appears to us that interest rates are now factoring in several more rate hikes. Let’s face it, with the 2-year Treasury rate close to 5%, a lot of investors are moving money to risk free 2 year rates paying over 4.5%. This is a very big headwind for the stock markets. Additionally, earnings expectations will be lowered as analysts factor in increasing input and operating costs, rents, raw materials, transportation, and labor costs.
The stock market is facing a confluence of friction. No matter how robust these rallies are, we remain cautious and vigilant by incorporating our MarketGauge risk controls and risk mitigation strategies.

Why Do The MarketGauge Quant Strategies Work So Well?
As most of you are well aware, over the past 15 years we have developed a wide array of investment strategies that exploit disparate, different, and non-correlated investment edges. These strategies use stocks and ETFs. (Exchange Traded Funds which trade like a stock).
These well crafted strategies run the gamut on asset classes from small cap to midcap to large cap, from value to growth, commodities (including energy, alternative sources of energy, agricultural), different sectors, fixed income, interest rate hedges, and even that ability to prosper when the market is heading down (inverse ETFs).
Their innovative key is the powerful technical tools and algorithms we have built to uncover and exploit these investment edges. Add to this automatic monthly rotations, stops, targets and strict disciplined formulas for entering and exiting the market and you will come to realize that these QUANTITATIVE strategies are able to do a better job than we, or just about anybody, can do on a discretionary basis.
More importantly, they involve techniques to minimize the downside and reduce risk .
We then took this process further by marrying and matching these investment strategies together in favorable ways to create optimized investment solutions based on risk and return portfolio dynamics. The end result is our offering of 5 Dynamic Portfolio Blends (DPBs).
Many of our individual strategies are performing exceptionally well as we start 2023 and through this choppy and volatile stock and bond markets. As an example, here are a few of the strategies that MGAM utilizes in our Dynamic Portfolio Blends:
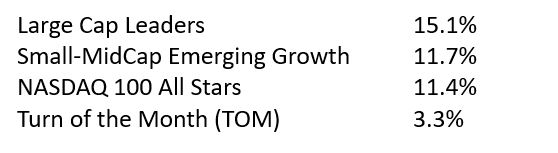
We just created a new Equity Only Portfolio Blend utilizing the above 4 stragegies that we can manage for you through MGAM. This Blend has produced a 12.4% annual rate of return over the past 6 years, would be up over 6% this year through Thursday, February 2nd, and has had drawdowns of half or less of the S&P 500 during the 6 years.
If you would like to receive information about our Investment Strategies and/or our Dynamic Portfolio Blend offerings, please contact Keith at [email protected] or me at [email protected].
An Exciting New Offering
MarketGauge released a new Crypto strategy dedicated exclusively to trading Bitcoin, either through Bitcoin (BTC), or it can be executed through Bitcoin dedicated ETFs (these don’t require a cryptocurrency account and can be traded in your regular brokerage account and through qualified plans).
We are proud to introduce you to CRYPTO SPRINT (there is a deeper meaning for SPRINT here). If you would like to watch the introductory presentation that Geoff delivered last Friday, click here.
Just as an aside and perhaps to motivate you to look deeper into this strategy, here is the backtested equity curve from the past few years. You will be shocked (as we were) to know that this strategy’s max drawdown is only 19% for a trading vehicle (BTC) that had an 85% drawdown. See the chart below for the hypothetical track record:

Here are the rest of this week’s important points taken from the Big View:
-
Risk-On
-
Neutral

Every week you'll gain actionable insight with:


