This week we wrap up this series looking at different risk and performance metrics. Building on the concepts of standard deviation introduced last week, we are going to get into the details of how the Sharpe and Sortino Ratios are calculated and what they tell us about risk-adjusted returns.
Risk-Adjusted Returns
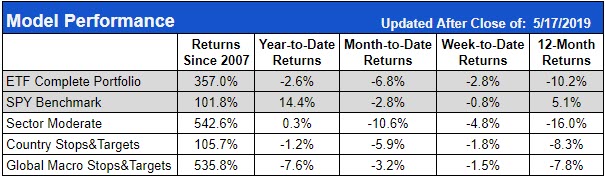
When you look at just performance, you could be comparing instruments or trading strategies that are vastly different in terms of the relative risks being taken or its appropriateness for different investing contexts.
It’s possible that a model that was only up 5% in a given period was actually taking considerably more risk than one that was up 10% (or vice versa). Risk here is measured using the standard deviation calculation. Standard deviation measures the volatility of a stock or trading model. The higher the volatility the higher the chance that the stock or trading model will have performance different from its historical average (positive or negative).
It should be noted here that standard deviation relies on a normal distribution (see last week’s article) and stocks are not exactly normally distributed. Stocks tend to have more frequent extreme outcomes (outsized daily moves or gaps) relative to a normal distribution. Because of this, these measures of risk become more “guidelines” or “best guesses” about the risks we will see in the future.
Sharpe & Sortino Ratios
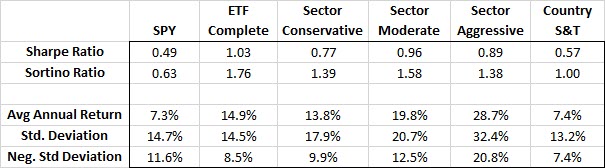
The Sharpe ratio is a common ratio used to compare the annualized returns of a model or a fund to its volatility (standard deviation).
The Sortino ratio is similar to the Sharpe ratio with the main difference being that instead of using the standard deviation of the whole sample, it only focuses on the standard deviation of the negative return months. The reason for this is that, in theory, as an investor we are mainly concerned about large negative moves and we might like large positive moves.
For some strategies, the two ratios might be very similar, signaling that the there is little difference between the positive and negative volatility. However, if the volatility is skewed in one direction, the Sortino ratio will pick this up (and in fact we see below that the ratio of the upside volatility compared to downside volatility significantly favors the ETF models over the S&P 500).