With roughly 2 hours left before the universal weekly close of the crypto market Bitcoin (BTC) is sitting right around $49,000, well below the $57,300 level needed to close green on the week.
This will be the first time that Bitcoin has had 3 consecutive red weekly closes since the coin was trading below $10,000 in June of 2020.
Global news such as supply chain issues, inflation and the spread of the new Omicron variant has not spared the crypto market. However, the potential for more lockdowns and stimulus this winter could be the boost that crypto needs to get back on track.
One thing that is clear at the moment is why crypto crashed this week. The selloff started on Friday as whales started dumping their coins and driving prices down, causing a cascade of liquidations on Saturday morning as Bitcoin’s price was suppressed -10.4% below the $50,000 long expiry level.
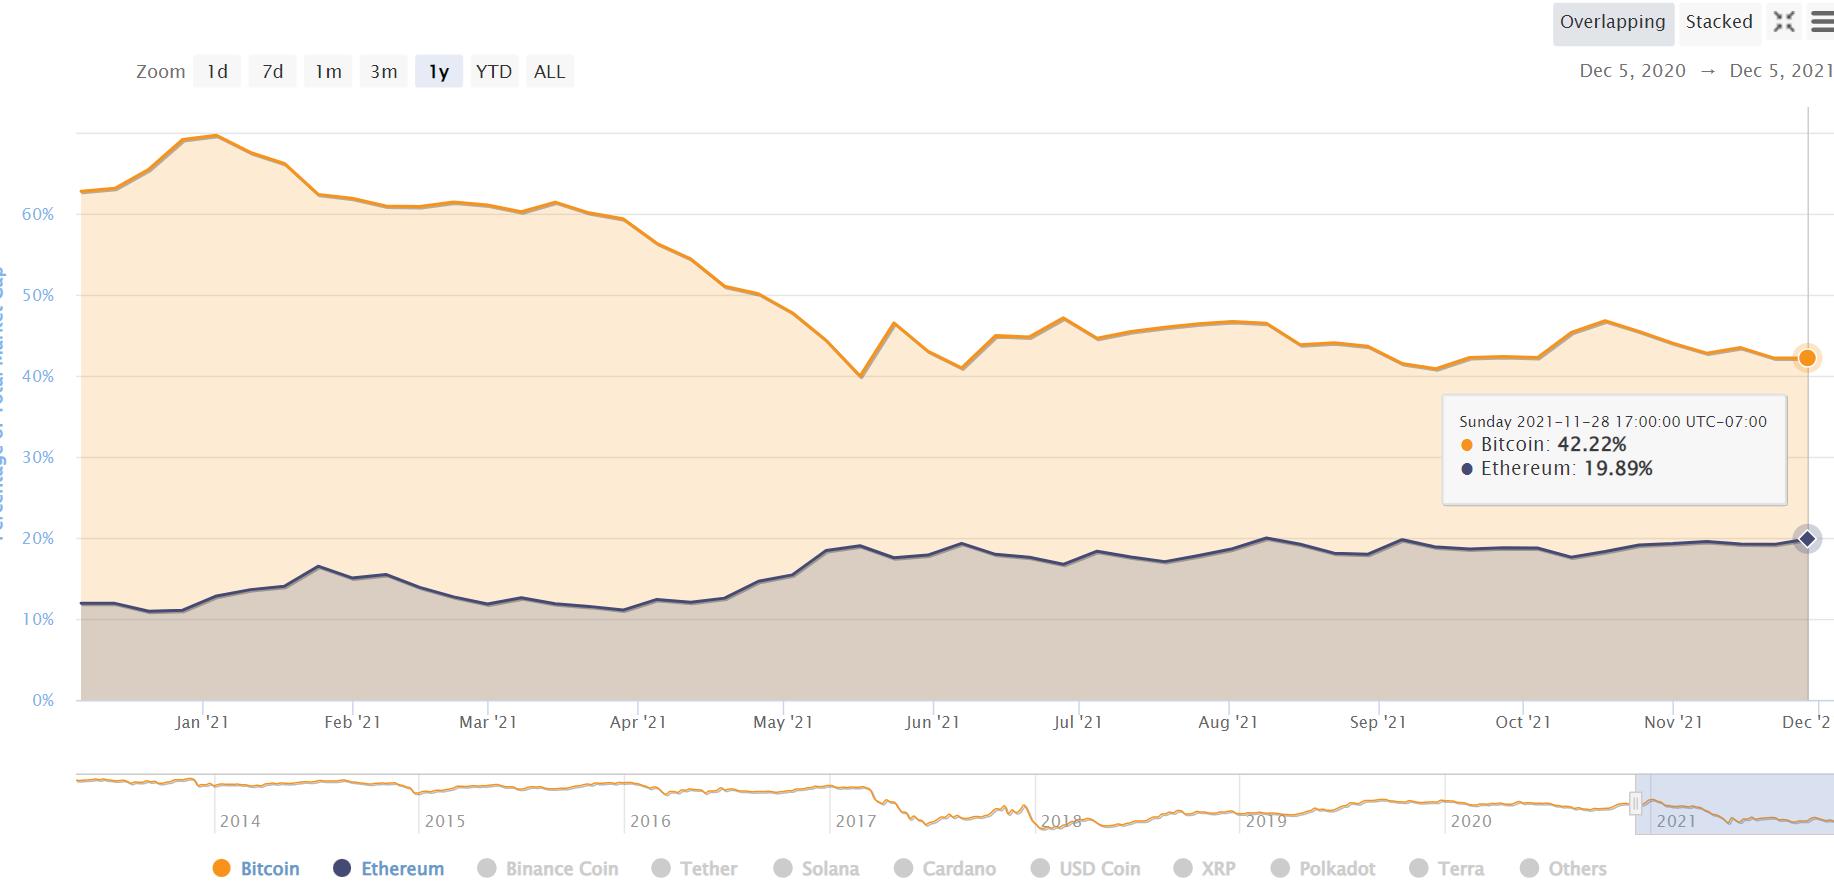
To add a bit more insult to injury on Bitcoin’s recently disastrous price performance, as we approach the end of 2021 we can see that Ethereum has captured nearly 8% more of the total crypto market cap while Bitcoin has lost over 20% of its dominance within the past year (See BTC/ETH Market Cap Dominance below). Currently BTC has a 42.22% market dominance, while ETH has 19.89%.
Other events this week...
Biggest Winners: Terra (LUNA) has jumped to the #10 slot by market cap on a +35% week. The project is known for its massive stablecoin infrastructure, which would explain why many in the crypto space flock to the coin as a hedge during market drawdowns. Polygon (MATIC) was also up +22% on the week and is maintaining a strong long-term trend.
Biggest Losers: Bitcoin obviously served as the catalyst of this weeks marketwide selloff, but was only down -15% on the week compared to others that were hit harder like Polkadot (DOT) -24%, Avalanche (AVAX) -25.8%, and Chainlink (LINK) -24%.
What to watch: Look for large volumes on accumulation days this week as whales and institutional buyers are likely to continue to scoop up cryptos at a discount after forcing the selloff.
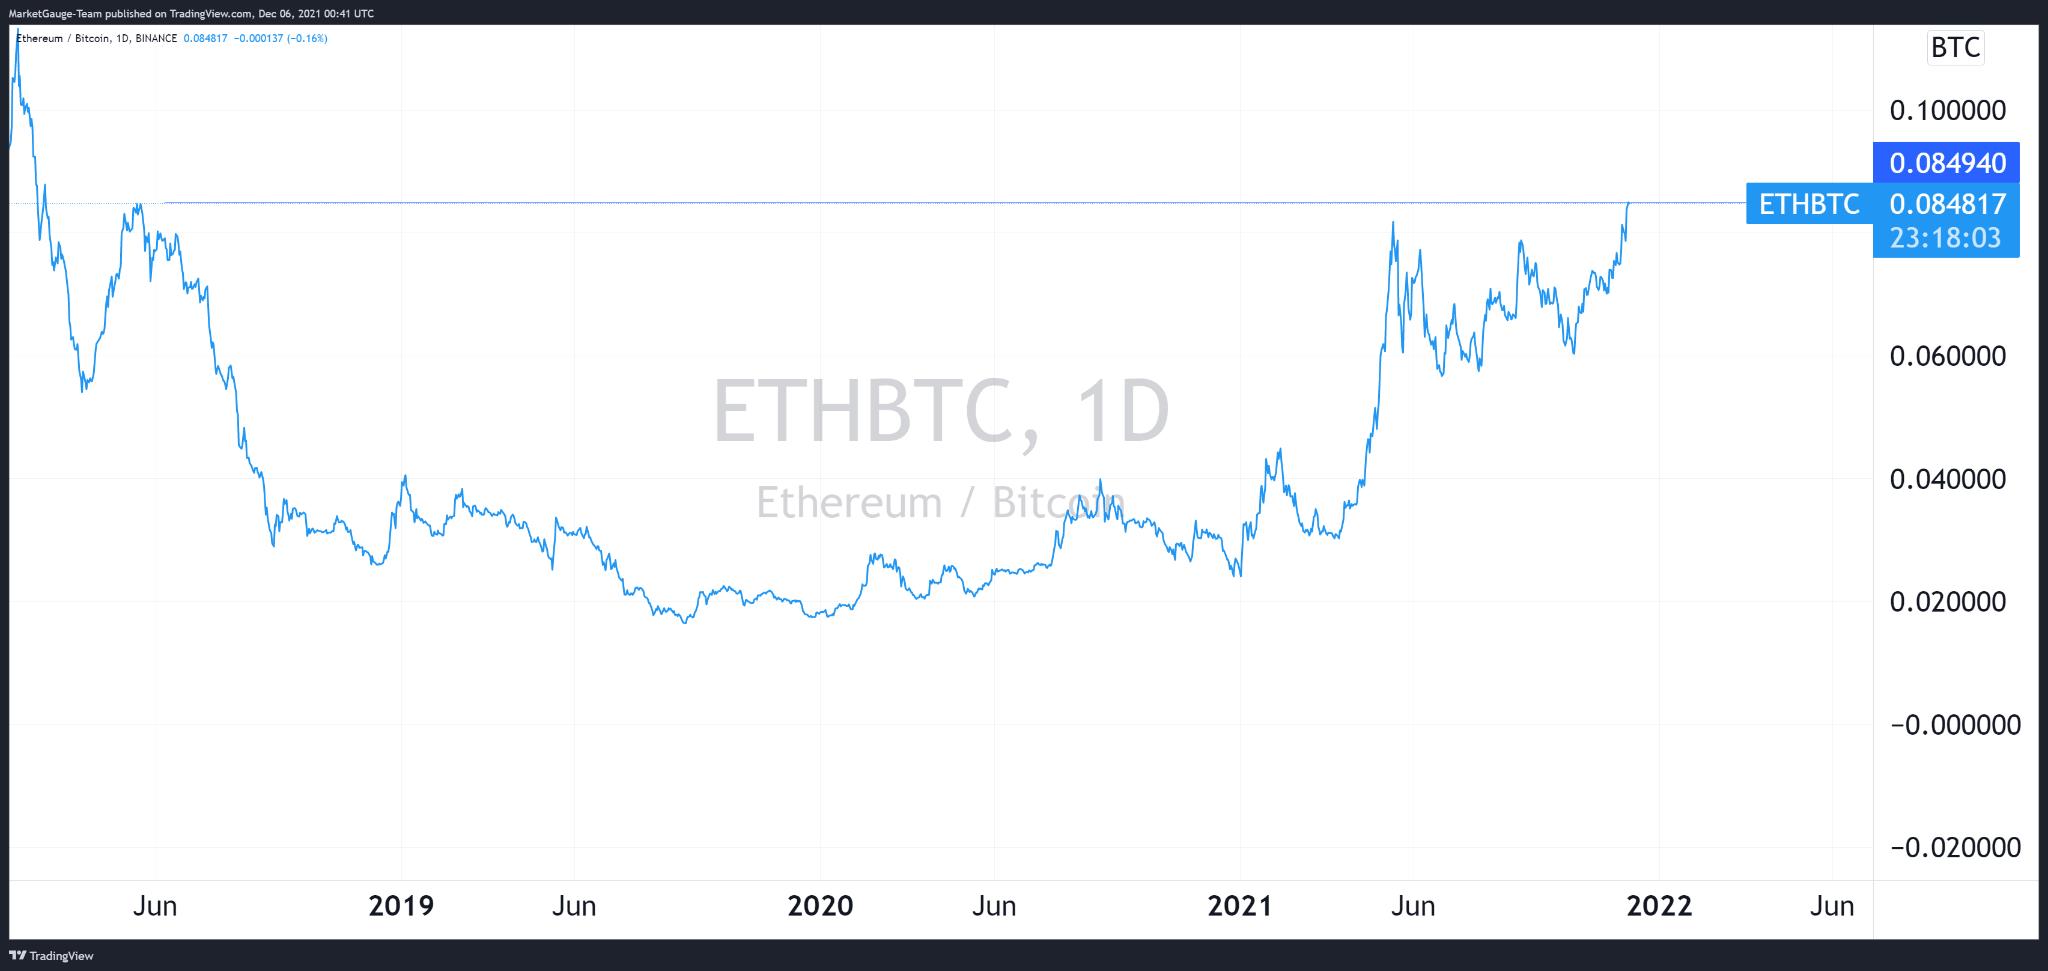
Ethereum was down a mild 3.9% on the week, not closing below the $4,100 level a single day this week despite the selloff. Even more impressive is the fact that ETH/BTC ratio is now at 0.0849, the widest margin of relative outperformance since May 2018.
Institutional buying is the main reason for Ethereum’s outperformance, as Bitcoin has already been held by major banks, funds and companies for months as a store-of-value and potential hedge against inflation.
Now, institutional buying is diversifying into more functional altcoins such as Ethereum which has a major network of decentralized applications and services built on their blockchain, as well as the ERC-20 standard which allows other tokens to be compatible across the Ethereum network.
Simply put, defi projects like Ethereum have significantly more functionality than Bitcoin does. Bitcoin primarily serves as a monetary asset for the storage of value or for payments, while Ethereum, Solana, Avalanche and so many others have created entire self-governed digital financial networks.
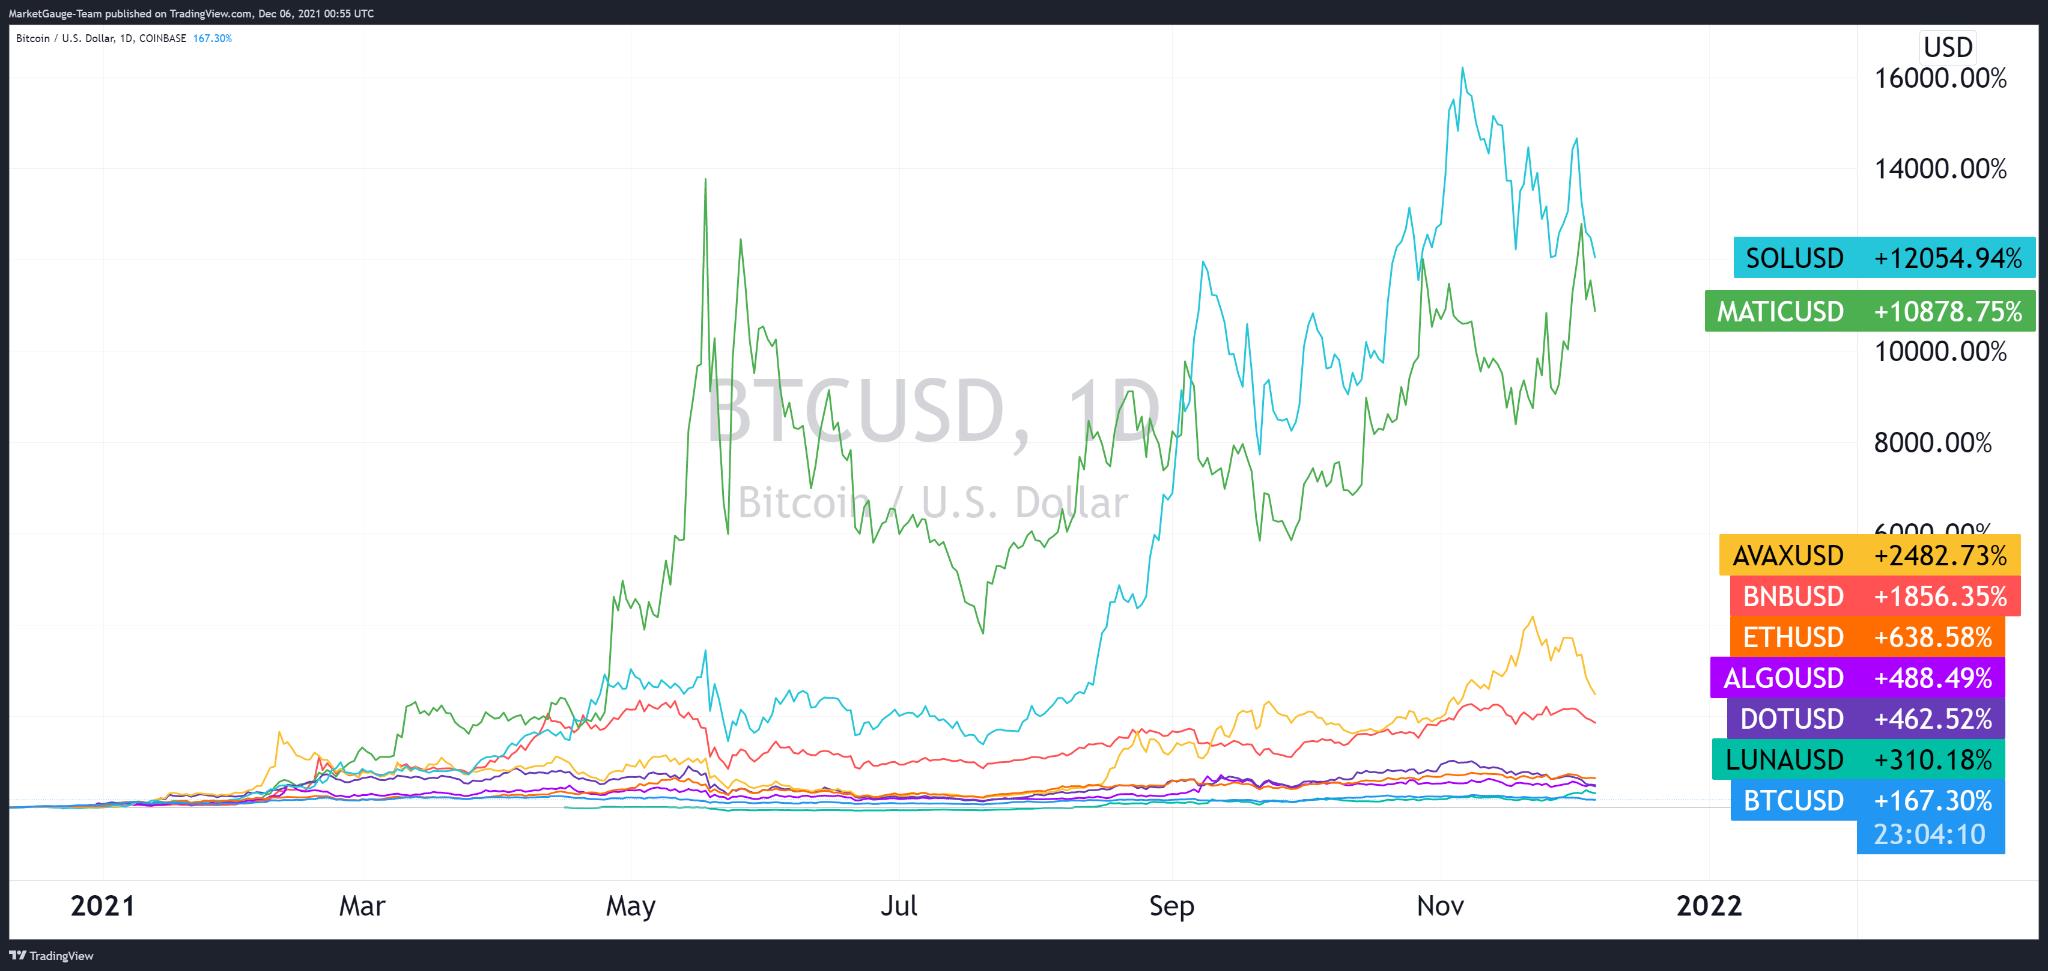
If you’re new to crypto then you may not be extremely familiar with altcoins, but the trend of other coins outperforming Bitcoin is actually not just a recent phenomena… Year to date, Bitcoin is underperforming every other major altcoin.
Now that whales have flushed out leveraged long positions, expect to see some pretty big volume on green daily candles this week as they accumulate back their coins at discounted rates.
As global equity markets look as shaky and weak as ever, the trickle down effect on crypto could be interesting. Many still believe that we are undergoing a financial paradigm shift and that value will continue to shift to new forms of digital currencies. At the very least, we can expect a bumpy ride to finish out the year.
To track our CryptoPulse Quant trading strategy or use our crypto tools and resources, please check everything out here:
CryptoPulse Quant
*Simply click a symbol on either the Sectors Radar or Coin Rankings in order to see an interactive chart*