Solid or Liquid Gold?
“The eye sees only what the mind is prepared to comprehend” Henri Bergson
Aphantasia is a hypothetical condition in which a person cannot mentally visualize imagery. For example, if you ask a person to describe even the most familiar image, a mother’s face, that person cannot. In essence, it’s a blind mind’s eye.
Professor Zeman, a cognitive and behavioral neurologist at the University of Exeter, thinks it may affect up to one in 50 people.
Luckily, in trading and investing, one can rely on charts and not a “mind’s eye” memory of price action. Even with that, traders look at identical charts yet draw very different conclusions.
Perhaps it’s because they are not literal, and “see” images imagined rather than real. Perhaps it’s because chart reading requires one to see the past in order to predict the future. We tend to make predictions based on our own experiences and not solely on mathematical probability. The trader’s dilemma- our own psychology-gets in the way.
Take the Gold chart (GLD) for example. While some were buying at the beginning of 2016, others were predicting that gold would break $1000 an ounce and head much lower.
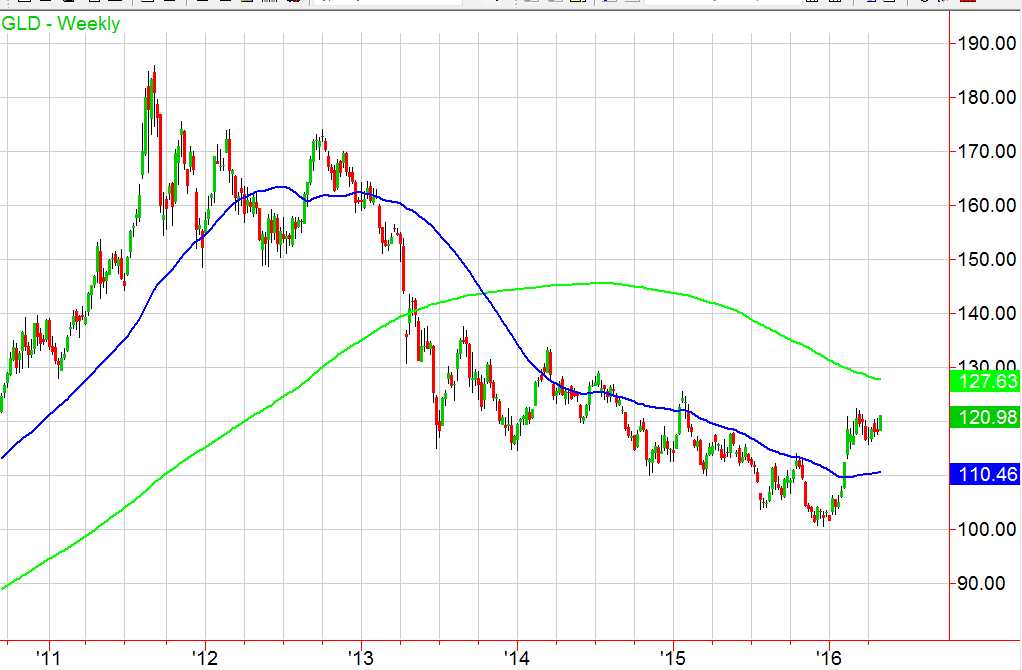
Above is the weekly chart in GLD. What do you “see?”
Do you see the last several weeks of consolidation preparing for a breakdown with an eventual drop in price back to around 110? Do you see that consolidation preparing for a breakout in price with a move up to 127.60 the 200 week moving average?
Even if you do “see” or predict which direction, do you have the patience to wait for that breakout/down from recent consolidation to reconcile?
Do you look at chart patterns? Phase and moving averages? Fibonacci sequences? What about new weekly high closes or low closes? Heck, do you even look at charts? And if so, do you look at charts across several timeframes?
If you are a fundamental trader, maybe you don’t even look at charts.
Turns out, preliminary studies indicate that those with Aphantasia compensate with a good memory or solid problem-solving skills.
Therefore, the takeaway is that when it comes to chart reading, even if you are adept at conjuring up images in your mind, make sure you compensate with solid problem solving. That means a trading plan with a predetermined risk/reward.
S&P 500 (SPY) 207 big support then 205, 202 with 200 game changer Subscribers: Negative pivots in all
Russell 2000 (IWM) 113.20 daily chart support. Then 112.00. Has to close the week above the 50 week moving average at 114.40.
Dow (DIA) 178 support then 174. 181.42 recent highs
Nasdaq (QQQ) Unconfirmed return to bearish phase. 105 support. 108 pivotal
Volatility Index (VIX) Another possible good reversal candle-new lows, close on highs with volume
XLF (Financials) 23.21 the 200 DMA
KRE (Regional Banks) Unconfirmed recovery phase. 40.40 some support. Weekly chart resistance at 41.08 to clear by Friday
SMH (Semiconductors) Broke 54 making that pivotal. 52.80 key weekly support
IYT (Transportation) Needs to clear 148 hold 140
IBB (Biotechnology) 266.75 the 50 DMA
XRT (Retail) 45.50 the weekly MA to close above and 44.50 support to hold
IYR (Real Estate) 77.40 pivotal, especially on a closing basis
GLD (Gold Trust) If closes the week over 120.54 it’s a new high weekly close for 2016
SLV (Silver) And we are out of the consolidation-
GDX (Gold Miners) Getting close to resistance and overbought but still running
USO (US Oil Fund) 11.42 the 2016 high way back in January
XOP (Oil and Gas Exploration) 35.55 the number to close above this week
TAN (Guggenheim Solar Energy) Room to 23.38 and better if holds 24
TLT (iShares 20+ Year Treasuries) 129.50-130 key resistance
UUP (Dollar Bull) New 2016 low
RSX (Russia) Subscribers: 17.00 support and 18.00 resistance. Inside day
CORN (Corn) Subscribers: 21.05 support, like to see it test 22.50
DBA (PwrShs DB Ag Fd) Subscribers: 21.28 point to clear
DBC (DB Commodity Index) Subscribers: 14.70 the 50 week moving average
SGG (Sugar) Subscribers: A close over 35.92 this month looks great
PHO (Water) Subscribers: Must close week above 23.35 to maintain
***Market Tone: Short-term Positive 2 Intermediate-Term Positive 5 Long-Term Positive 7
NOTE: *All starred picks are from the automated list of picks (which now includes short picks!) denote that it has one or more of the 18 chart patterns we have used on the radar screen. For example, inside day, 2 days under floor trader pivots, phase change, brick wall or return to the 10 DMA, etc.
Longs
ACAS**
ACN**
ADBE**
AEM
AGQ
AMZN**
ATI
AVP
BDN
BIDU
BMY**
BUD**
CDE**
CL**
CLF**
CTRP**
CX
DLR
DTE
EL
EMN**
EMR**
EW
F**
FB**
FCX
FNSR
GG**
GLPI
HD**
HOT**
KBH**
LULU
MAR**
MJN**
MT
OC**
PX**
TEX
TMO**
TRMB**
TSLA
UPRO**
VRTX**
WHR**
X
XME**
Shorts
AAL
AAPL
ALXN
BBBY
CTB
DXJ**
EA
ERJ
GNC
ILMN
INCY
JBLU
JWN
LEN
MYL
NKE
NTAP
RCL
REGN
STRZA
TOL
UAL
XL
