January 7, 2024
Small Caps Idea Lab
By Geoff Bysshe
Two Stocks Are Jumping Out of Today’s Scan
The first week of the year is done, and the market was decidedly down. For more analysis on the market action, look at Mish’s Daily and Market Outlook.
Here I’m going to point out a few ways you can find insightful and potentially trade worthy conditions within the Small Caps list using the Complete Trader dashboard.
I know you may not have all the indicators in this table. That’s ok, especially for today.
I’m going to focus on what you do have, which is the 10-day and 50-day moving averages and the January Opening Range.
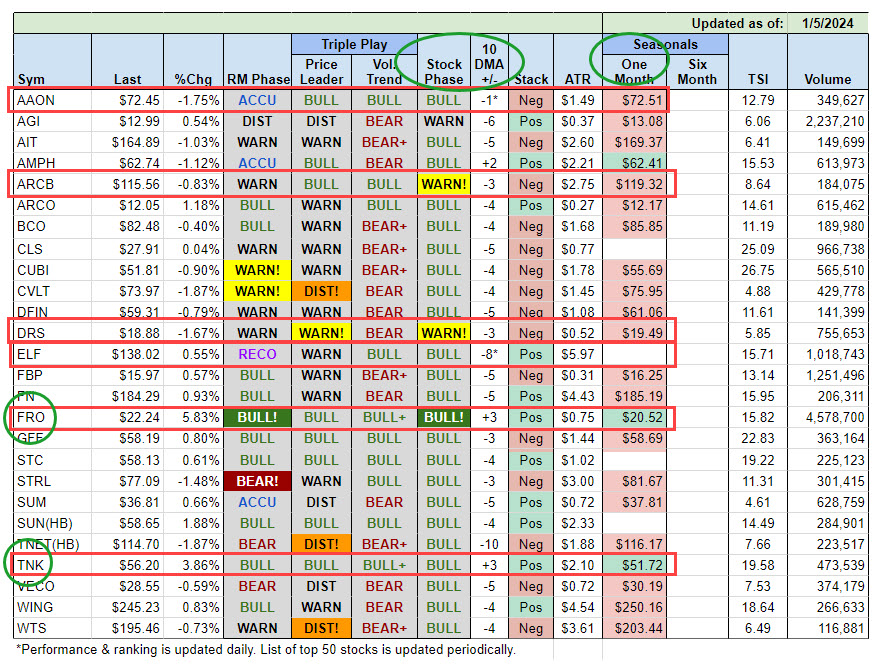
The screenshot below is not the complete table. I reduced it to emphasize a few stocks.
With the market down last week, it’s a good time to look for strong relative performance and stocks at areas of support.
Here are a few ways to do that with this table.
The “Stock Phase” Column
In the “Stock Phase” column, when a cell has a solid color background it’s highlighted to indicator the stock changed phase. This is most often a result of the price moving through the 50 or 200-day moving average. I can also mean the moving average crossed.
A phase change, therefore, suggests the stock in at support or resistance which could be reason to look for either a breakout or reversal.
Watch FRO
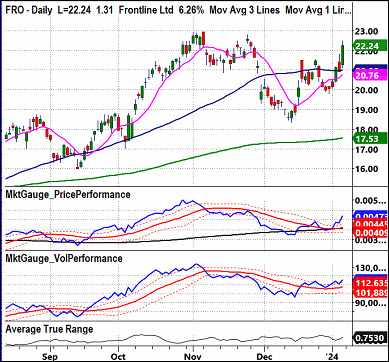
One example is FRO, which is green and “BULL,” indicating its move into a Phase (Price > 50-day > 200-day). Thursday, it closed under the 50-day, Friday (today, it closed over). This happens to look like a nice breakout for several reasons including that it’s breaking out of a well defined 3-week range. I also like that all the indicators are bullish – Triple Play, Real Motion, the 10-DMA and the One Month seasonal (it’s over the January Opening Range – first day’s range).
You can see it in this table, but it’s also a shipping company in the energy sector which is one of the few sectors that had a bullish week.It’s notable that another company on this list TNK which is also a shipping company in the energy sector is also “all bullish” today.
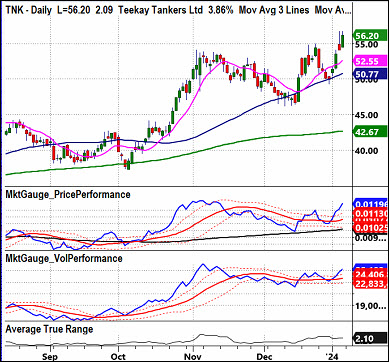
TNK looks even stronger. It’s at new highs and breaking out of
Keep an eye on these two.
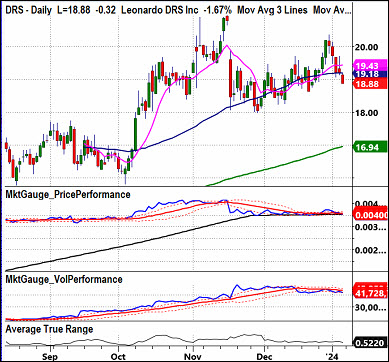
Two Types of "Warnings"
Two other examples of phase changes are ARCB and DRS which have a Warning Phase alert (“WARN”). This means the stock crossed down below its 50-day that is over its 200-day MA.
This alert isn’t always bearish since the 50-day can be an area of support.
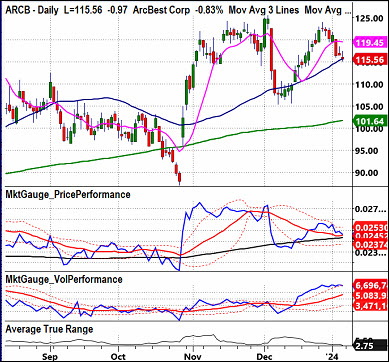
Today is a good example, ARCB has bullish Triple Play (according to the display) and on the chart the price is not breaking the 50-day by much.
DRS, on the other hand has bearish and warning indications on Triple Play and it’s a more significant break down in price. This one looks like a breakdown as a opposed to ARCB which could hold.
The 10-DMA Column
This column tracks the number of consecutive days the stock has closed over or under the 10-day moving average.
If there is an “*” in the display then the stock’s range is straddling the MA.
With the indexes all under their 10-day it’s worth noting which stocks in our list are “stronger” by this measure by simple looking at which are positive.
FRO as we mentioned above is +3 so we know that not only is it over its 10-day but it’s been there for a few days. TNK too.
AAON has a “-1*” which tells you today was the first day under the 10-day and the “*” tells you that its high is still over the 10-day. Since the Stock Phase and Triple Play are bullish. There is a good chance you’ll find this one to be in a good trend. In fact, it is in a strong trend, and it has a nice flag down to the 10-day.
In summary, a quick way to use this column is to look for small numbers as that will indicate a fresh cross of the 10-day and look for the “*” as that will tell you that the stock is straddling the MA.
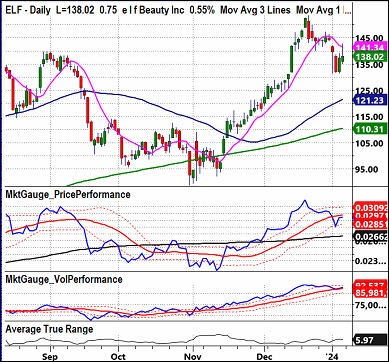
ELF, for example, has a -4 but it has a “*” so without looking at the chart I know if it takes out today high it will be breakout over the 10-day. This may be worth knowing considering its One Month Seasonal is not red. It’s blank indicating that ELF is still inside its first day of the month range. Add that all up and you know that ELF is consolidating right under its 10-DMA and it’s in a bullish phase.
One Final BIG Pattern
If you haven’t taken our Calendar Range or January Trend Trade Training, this may be new to you, and if you have, then you should be focused on this with even more detail than I’ll get into here…
The One Month column shows you which stocks are above, below, or within their first day’s range. With the market’s correction this month, this column give you a great scan for stocks that are on the move to the upside over the coming days or weeks!
Anything that turns green is breaking out to new highs for the year – that’s potentially very bullish if the general market isn’t too weak.
Remember, this is a list of stocks that could run.
Scan this column daily if you’d like new trade ideas.
Keep in mind Green or Red means it’s over or under the month’s O.R. There isn’t a way to know that today is the breakout day.
Conclusion
If you’re new to this table, it can seem like information overload.
Don’t read it like a newspaper.
After a few days of looking at it, you can learn to look for the patterns that fit your trading style. Maybe one that I’ve mentioned today?