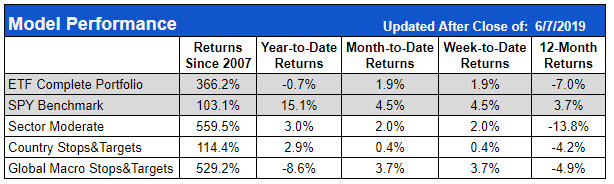
(The image above is for reference. The values change over-time as each ETF fluctuates in price)
DRN was 29% of the portfolio, which works out to about $1450 for that position, or 62 shares. TAN was 37% of the portfolio, or about $1850 which equates to 74 shares. GDX was 34% of the portfolio, a $1700 portfolio or 77 shares.
Regardless of where these positions are relative to where the model entered them, if you started a $5,000 portfolio with these share totals, the percentage changes in your portfolio should follow very closely to the percentage changes reported by the model portfolio.
At this point, you could either put in resting good-til-canceled orders for the stops and targets or you can monitor the positions and place the orders when they would have triggered. The stops are always for the full remaining position however, the targets are variable. At the first profit target, 1/3rd of the position will be sold. At the second target, one half of the remaining position will be sold (or 1/3rd of the original position size). The final target, if hit exits the remaining position.
The first position change that would have come up during this period would have been on April 1st when the model recommended rotating out of the DRN (Real Estate) into SOXL (Semiconductors). Over the prior month, DRN had gone from the $23.28 entry price to $25.47, a 9% gain. That portfolio slot has grown from $1450 to $1580. That new value will be used to figure out how many shares of SOXL to buy.
Over the prior month, the overall portfolio is only up a couple percent, so you could still use the sample $5,000 portfolio for position sizing or do your own custom calculations for the exact value on the day of the position change.
The share calculator on the website showed DRN was now 32% of the portfolio or roughly $1580. If you rounded up, that would be 108 shares of SOXL at $147.44 to fill this portfolio slot.
After this portfolio change, there were no changes for the next two weeks, however, that SOXL position that you put on is now up considerably and on April 17th, it gapped above our first target of $184.30 and opened at $191.00. If you had the profit target already in the market, it should have executed on the open, otherwise you would manually sell 1/3rd of the SOXL position or 36 shares in our example. The funds from selling the 36 shares will remain in cash for now.
A few days later, the model made the final position change for the two-month sample period. On April 22nd, it recommended rotating out of GDX (Gold Miners) into TECL (Technology). At this point, the portfolio is up about 10% from the initial $5,000 amount, or now roughly $5,500. You can use the sample $5,000 portfolio totals and increase them a little (around 10%), or you use the reported “% of Total Portfolio” to manually calculate the number of shares to buy.
To manually calculate the correct number of shares, you take total portfolio value ($5,500) and multiple it by the percentage that portfolio slot takes up (30%) to get the dollar amount for that portfolio slot ($1,625). TECL was trading around $162.50, so that works out to about 10 shares of TECL.
We have now walked through all the essential calculations and actions you would have taken to follow along with the portfolio over this two-month period. This is probably a typical amount of activity, though some periods may have more or less activity.
Next week we will wrap up this series with some final thoughts and considerations to aid in following along with the model portfolios.