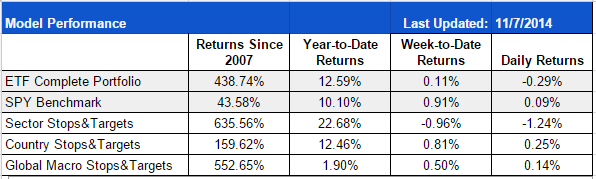
The SPY had several days of indecision this week before finally putting in solid new all-time highs on Thursday and Friday. The ETF Complete Portfolio was doing well but a selloff in SOXL the last two days of the week eroded some of our gains. We remain positioned with a mix of long and alternative holdings. DRN came very close to hitting a target on Tuesday but has since backed off.
Please use the link below to see the detailed breakdown of all the ETF Complete Portfolio’s current positions and past performance:
https://marketgauge.com/recommendations/etf-complete/etf-complete-model-portfolio/
If you have any questions about getting started please drop us an email at:[email protected]
This Week’s Strategy Lesson: Expectations and Expected Value

Expectations are very important, especially when you are trading a system. One of the main reasons we like to look at past performance or back-test a trading system is so that we can develop realistic expectations for how the system works and the types of trades we will get into.
Financial markets are considered to have a fair degree of randomness. While we can expect that markets will react to news events in somewhat predictable ways and the long-term value of a stock might stay close to its fundamental value, over any given period of time it’s not possible to predict what will happen with any certainty.
That is why we deal a lot with probabilities and expected value. We have covered expected value before but it might be helpful to go over that concept again. On an intuitive level, expected value is the long-run average of a high number of repetitions or outcomes. If you rolled a dice a thousand times, the average of all those rolls would be around 3.5.
For the ETF Sector Plus stops and targets, the expected value of any trade you put on is 5.5% (for this, I will use data from the ETF sector model but the data from the others models are of a similar distribution).
The 5.5% is the average return of all the 129 trades in the model’s history to date. And while it may be true that on average, you can expect to make 5.5% on that trade, in practice the result of any given trade could be a wide range of outcomes and sometimes it’s not easy for us humans to think and act with the long-term probabilities in mind.
If we peal back the layers of expected value, we can come up with a probability distribution that can tell us a lot more information than just the 5.5%. We know from the past trade history that the range of trade outcomes runs from -17% (the worst trade, a time when an ETF gapped down below our 15% stop) to +61.7% (the maximum you can make on a trade based on our stop and target rules).
We can take our trade history and do a probability-weighted calculation to come up with the expected value or average return for trades of different likelihoods. This is commonly then mapped onto a chart breaking these values into different deciles (10% probability brackets).

There are a few things we can observe from this. The bottom 20% of trades (average of first two bars) average an 11% loss while the top 30% of trades average 27%. We can definitely observe that the distribution of trades is skewed positive with the best average bracket gain being more than three times higher than the worst average bracket loss.
But you can also see that the middle half from roughly 20% to 70% of trades average to about breakeven. This means that while the average return on a trade might be 5.5%, nearly half of the trades basically cancel each other out with small gains or small losses.
While we would love for every trade to be a winner and post massive gains, this middle half of trades that end up breaking even is almost part of the design. It’s important for the model to be always ready for the next potential big mover.
Unfortunately, we don’t know which trade signal will be that next big trade, all we know is that a particular number of them will do great, many will effectively breakeven, and a few will do poorly.
Understanding this can keep our expectations in line with the models history and help us to stick with the rules even if we have a short series of lackluster trades or a period of underperformance because we know that in the long run, taking all the trades offers an excellent expected value.
The Current Condition of the Model
We are in seven out of the potential nine maximum portfolio positions.
SOXL and TLT are in the buy zone. SOXL may be replaced soon if its TSI score slides any further.
Stay tuned to the daily emails for any position changes and updates.
Best wishes for your trading,
James Kimball
Trader & Analyst
MarketGauge
