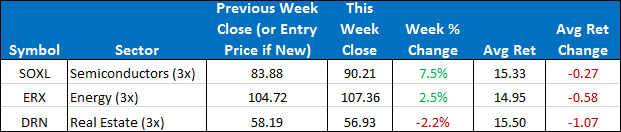
This week there were no position changes in the Sector Plus model. Our current three positions are SOXL, ERX, and DRN. To open next week, we will remain in those three ETFs.
The SPY closed the week up +1.22%. The ETF Sector Plus model more than doubled the benchmark ending up +2.63%. The ETF Sector Plus Strategy is up +21.31% year-to-date compared to its benchmark, the SPY, which is now up +3.06% year-to-date.
This Week’s Strategy Lesson: Designing a Strategy (Part 5)

This week we are continuing our series on how to build a model around our core concept of trend strength and persistence. Last week we covered the important topic of money management. This week we will be talking about ways to make our system more robust for both bull and bear market conditions and how important it can be to avoid taking large losses.
Avoiding the Bear Traps
There are many systems that are designed to only work in certain environments like a trending or choppy market, or a bull or bear market. These models might post great returns when the conditions are right, but it can often be hard to diagnose or guess what type of market conditions we could be headed for next.
One goal of our ETF models was that we wanted them to work in nearly every market environment—to beat the market when it’s going up and beat it when it goes down, hopefully on both a relative basis and still give us good absolute performance.
The basic idea for our strategy already worked well in bull markets. The Trend Strength Indicator was identifying the strongest ETFs with the best chance of continuing to appreciate going forward. But we would have to make some alterations and additions to our model to give it the same strength in bear markets.
Don’t Buy Negative Trending ETFs
Our model is based on a relative ranking of the ETFs based on trend strength, but what happens in a bear market? First, correlations between stocks tend to increase, meaning all stocks have a higher tendency to move together. Secondly, most stocks tend to move down in bear markets. In this type of environment, the best relative stocks might still be going down on an absolute basis.
This is where we decided to see if limiting our holdings to only positive TSI stocks helped the model. A lot of the process of designing a model is coming up with ideas that have some basis for working and then testing to see how they affect the model and from there you continue to iterate on your idea until you are happy with the result.
Limiting our holdings to positive TSI ETFs helped our model quite a bit because we avoided the bottoms of many market troughs. We would sell out of an ETF long before they hit rock bottom, but it left us in cash quite a bit during prolonged downtrends.
Include Negatively Correlated ETFs
In bear markets, cash might be better than following the market down, but we thought there was still room for improvement. Depending on market conditions, it might take some time for the TSI to go negative during the start of a bear market. And once it became negative, you were stuck earning 0% return from cash. We needed a way to circumvent both of these problems.
We decided to look at including some negatively correlated ETFs into the model, most notably a bear market index (like the bear SPY, the SDS) and long treasuries (like the TLT or TMF). These types of ETFs often (or are specifically designed) to move opposite of the market. They are bullish when the market is bearish.
They also have the benefit of interacting with our trend strength indicator in some positive ways. They give us more options for positive TSI ETFs and often mean we can get out of the bullish ETFs into the bearish ETFs without having to ride the old picks all the way to zero on the TSI. Quicker transitions between market types can mean smaller drawdowns and ultimately improve your performance
Importance of Avoiding Losses
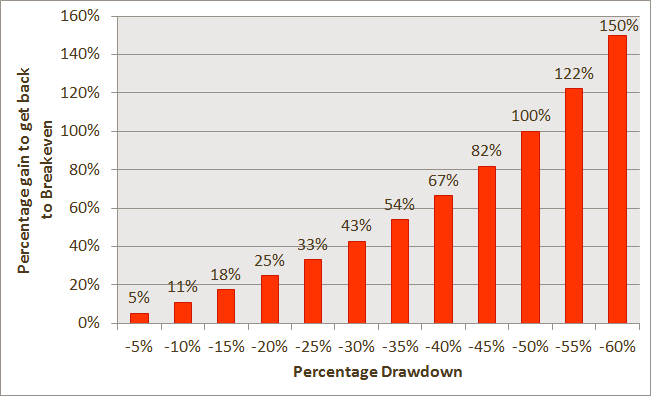
It’s been called the arithmetic of portfolio losses. It’s a bit of an odd property of percent changes. The simple fact is if your portfolio goes down by 10%, you have to make more than 10% of what’s left just to get back to even—closer to 11% in this case, but the numbers get progressively worse from there.
A 20% decline requires you to make 25% the next period to get back to even and a 50% decline requires a whopping 100% gain just to claw back to even. This is one reason the severe declines in the financial crises of 2008-2009 took so long to recover from (if you were fortunate enough to ride it back up from the bottom).
The net result of these changes helped transform our basic model from just a bull-market friendly strategy to one that was ready to take on full economic cycle from peak to trough and back to peak. Stay tuned next week as we have just two more parts left in this series.
The Current Condition of the Model
For the Sector model, we remain in SOXL, ERX, and DRN. TMF is in fourth place but is still significantly lagging our top three positions in “Av Ret.” SOXL made a big recovery this week. No position changes are imminent in the sector model but stay tuned to the daily updates should there be any changes.
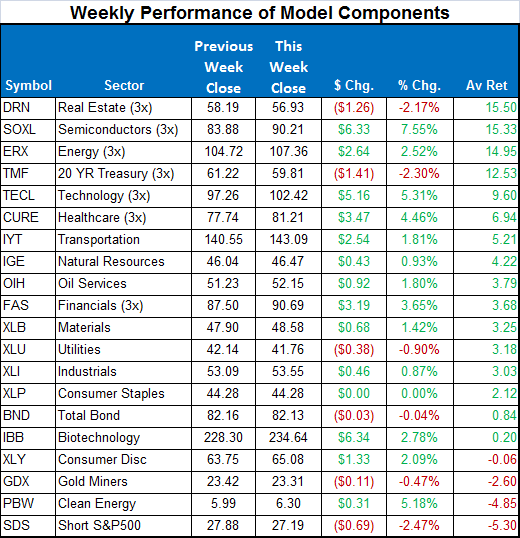
Here is a summary of the weekly performance of all the ETFs that the strategy monitors:
Best wishes for your trading,
James Kimball
Trader & Analyst
MarketGauge
