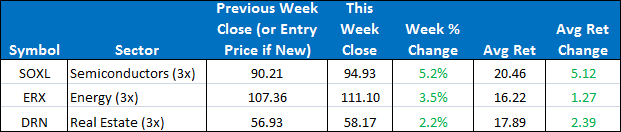
This week there were no position changes in the Sector Plus model. Our current three positions are SOXL, ERX, and DRN. To open next week, we will remain in those three ETFs.
The SPY closed the week up +1.22%. The ETF Sector Plus model tripled the benchmark ending up +3.63%. The ETF Sector Plus Strategy is up +25.71% year-to-date compared to its benchmark, the SPY, which is now up +4.54% year-to-date.
This Week’s Strategy Lesson: Designing a Strategy (Part 6)

We are nearing the end of this extended series on how to design and build a trading strategy. We have been focusing on how this relates to our ETF models, but many of the general principles can be applied to the creation of almost any strategy system. This week we cover some of the final refinements we made before we start to draw this series to a close.
Calibrating an Indicator
Calibration is an important part of any process, from learning to drive to learning to trade. It is the process by which we take broad ideas or concepts and attempt to transform them into increasingly precise predictions or actions we can take. Different circumstances will result in different levels of calibration or different levels of confidence about the accuracy rate of our predictions.
In Santa Fe, I can come up with a very precise travel time to work in the morning. The trip is short. Traffic is consistent and light. There aren’t a lot of variables to contend with. However, when I lived in Philadelphia, calculating a precise commute time was near impossible. While I could calculate an average travel time, there were frequent traffic jams, accidents, or lane closures that could double (even triple) the travel time. Precision was not possible in that environment. Each new day had to be treated as a partially random event.
It can be the same thing with trading. We want to be as precise as we can be while acknowledging the limits of our knowledge and that markets are a randomness-laden environment.
We started with a simple six month return. Through a lot of key research done by James O’Shaughnessy and others, we knew that it was a great starting point for identifying which stocks/ETFs might go on to perform the best going forward. It was no guarantee that any one instrument would go up, but it gave us a probabilistic edge.
We then started to work on deriving a more sophisticated way to measure this return. It was possible that sophisticated measures would not perform any better, but we would not know without doing the rigorous analysis and backtesting.
We took the simple six month return and converted it to a multi-time framed momentum indicator. This would allow us to try a variety of different weightings for different past periods and then run the settings through our models to see the results. From there, further calibration would be possible.
While we won’t disclose the final calculation we decided upon, understanding the process of this step is important. There were a few things we were focusing on. We wanted to see how “robust” the indicator was—meaning we wanted to see strong and how consistent the results remained from small tweaks. If small changes gave us vastly different results, then calibration would not be possible and it could even cause us to call into question using the six month return in the first place.
We also wanted to see if this indicator could be useful in multiple markets and with many different trading instruments. The more scenarios and combinations that it works for, the more likely we were touching on something that would continue to work, and not just some one-time “fluke” in the data.
Sometimes you might strike on something that is really precise and consistent, but more often than not, when dealing with markets, some degree of “fudge” is necessary. Markets are always in motion and if they were easy to predict, the “perfect” trading solution would be obvious by now.
The TSI / AV Rank that we tooled for ETF strategies proves to be a good refinement on a basic six month return indicator. It does a great job of being of being both quick and precise enough while still keeping its focus on the big trends.
Next week we will discuss how you can use multiple systems or strategies together to smooth out your returns and reduce the overall volatility of your trading.
The Current Condition of the Model
For the Sector model, we remain in SOXL, ERX, and DRN. TMF is in fourth place but is still lagging our top three positions in “Av Ret.” SOXL continues its strong performance leading the model this week. No position changes are imminent in the sector model but stay tuned to the daily updates should there be any changes.
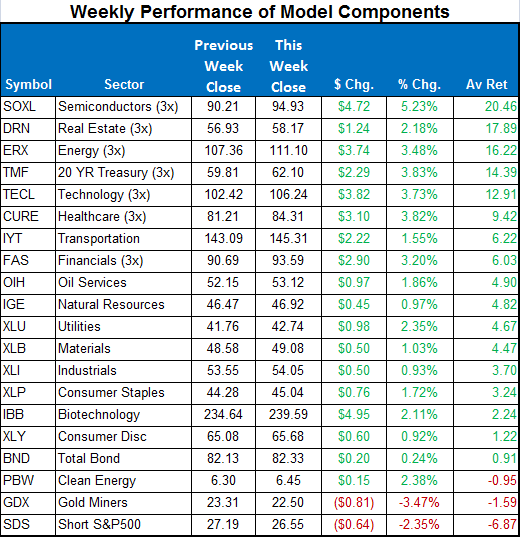
Here is a summary of the weekly performance of all the ETFs that the strategy monitors:
Best wishes for your trading,
James Kimball
Trader & Analyst
MarketGauge
