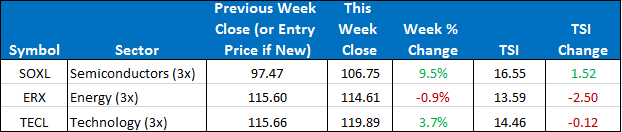
We entered TECL on Monday. There have been no new position changes since. In the Basic model, our three positions are SOXL, ERX, and TECL. In the Stops & Targets model we are out of SOXL, have 2/3rds of a positions in ERX and a full position in TECL.
The SPY closed the week up +1.28%. The ETF Sector Plus model was up +4.11%. The ETF Sector Plus Strategy is up +39.98% year-to-date compared to its benchmark, the SPY, which is now up +5.93% year-to-date.
This Week’s Strategy Lesson: Guidelines for Constructing a Portfolio
(Part 4)

We are going to wrap up this short series with a discussion of the effects and importance of diversification on a well-constructed portfolio.
Modern Portfolio Theory (MPT) is a complex and sometimes controversial area of finance that attempts to answer the question of how to construct the ideal portfolio.
It’s controversial because it can be difficult to use it in a precise way (mostly because the future is often different than the past). But there are some findings from it that are indisputable. To get to the conclusions we need to have at least a basic understanding of a few key concepts:
Expected Return
The expected return is just a weighted-average of the possible outcomes in any scenario. If a stock has a 50% chance of going up 10% and a 50% chance of going down 5% then the expected return is: (.5 *.1)+(.5*-.05)= 2.5%. On any given holding period it could be up 10% or down 5%, but if you held it over a hundred periods and averaged out your return, it should come out to around 2.5% each period. The ups and downs averaged out to a positive expected return.
The rub is that we cannot actually know the future expected return of a stock or ETF. You can attempt to forecast it based on some trends you see. But for the most part, we look at its past performance and infer that it might be similar going forward. While it might be difficult to be precisely correct on one stock, if we calculate this figure for a large number of stocks, we are more likely to be closer to right on average.
Standard Deviation
Standard Deviation is a statistical measurement that is used in finance to measure an instruments volatility. As an investor, we would prefer the highest possible return with the lowest possible volatility—basically an AAPL or TSLA that doubled in price without ever having a bad day. As you might have figured out by now, these don’t really exist. But looking at volatility can help us find and filter out stocks that have excess volatility without really rewarding you with excess returns.
For our purposes here, we don’t need to cover the actual calculation (it’s the square root of the variance for anyone wondering), however, it’s useful to understand what it means. A standard deviation of 2% means that about 2/3rd of the time we should expect the return to be plus or minus 2% of its average or expected level. No one wants to wake up tomorrow with their portfolio down 50%. So smaller variations are preferred.
Correlation Coefficient
The math gets fairly complicated on this one requiring the use of matrix algebra, however the concept itself is fairly simple. If two stocks tend to always go up on the same days and always go down on the same days (and by a similar proportion), we say that they are highly correlated. When they move in opposite directions, they are negatively correlated. And when there is no discernable relationship between how they move, we say they are uncorrelated.
Benefits of Diversification
If you only held one stock, then you are basically stuck with the expected return and volatility of that stock. But as soon as you introduce a second stock (ideally a stock that has different characteristics than the first one), by putting different amounts of your portfolio into each you have the ability to set up a whole range of different expected returns and volatility.
Let’s walk through an example. Say we have Stock A that has an expected return of 8% and a standard deviation of 10%. While Stock B has an expected return of 16% and a standard deviation of 20%. Stock B has twice the returns and twice the volatility of Stock A. For this scenario, let’s assume the two stocks are uncorrelated—that is, they typically march to their own beat on any given day.
If we list the 10 different portfolio allocations (incrementally holding more of one stock while holding less of the other) and then chart the expected return and standard deviation, we would come up with something along these lines:
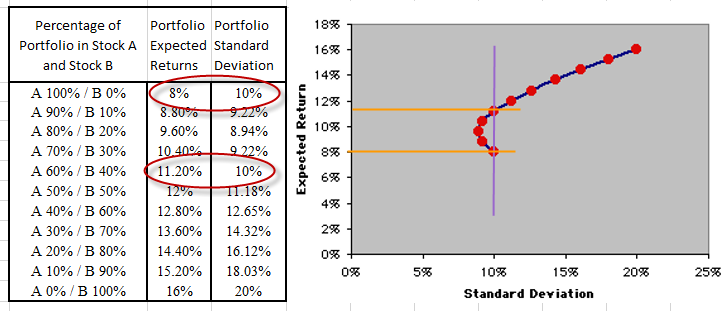
While this is still a very limited set of possibilities (remember we only have two holdings), we stumble upon a unique finding! At the 10% standard deviation level (holding risk constant), we can actually choose whether or not we want to get an 8% return or an 11.2% return simply by changing how much of our portfolio is in each. We can get a higher return with the same amount of risk (volatility) because we added some diversification. This is what’s known in the industry as a “free lunch.”
Our ETF strategies had this principally in mind when we designed them to have several holdings and ETFs that are differently correlated (like different sectors or global regions or countries) or uncorrelated (like the short ETFs). By trading all three holdings or trading multiple ETF models, you can typically achieve a better risk/return profile.
Most traders ignore these important trading concepts all together as they only concern themselves with the next hot trade. This is understandable. It takes time, effort and expertise to look at trading from both the perspective the individual trade and a portfolio of several positions. Fortunately, with any of our 4 ETF trading models this work is all done for you!
However, in order for you to take full advantage of this, you do need to follow your model’s rules, and establish positions in all of the models positions. It is ok if you’re just getting started, to build your portfolio over time as you scale in or wait for model positions to enter their “buy zone” (depending on your membership). If you need help getting started please review the “How to use the model” section in your member are and contact us at [email protected].
I hope this article gives you the incentive to focus on your ETF model for just a few minutes per week to build your positions and then enjoy trading your “portfolio” not just individual “set ups”.
The Current Condition of the Model
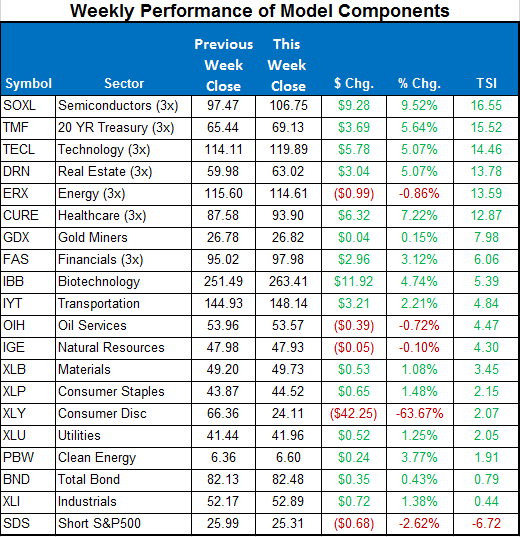
For the Sector model, we initiated a position change from DRN into TECL. TMF made the largest move this week jumping this week into our top three. Given ERX’s lagging recently, we might see that position being dropped out very soon. Pay attention to the daily updates for any position changes.
Here is a summary of the weekly performance of all the ETFs that the strategy monitors:
Best wishes for your trading,
James Kimball
Trader & Analyst
MarketGauge
