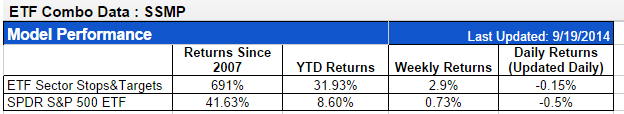
We have added more detailed performance data easily accessible on the website now. You can visit the “Model Portfolio” section of each model and view the performance data from 2007, Year-to-date, Weekly (all updated on Friday), and daily performance (updated daily). Here is a cutout of the new data section:
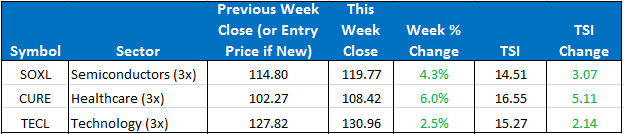
In the Basic model, our three positions are SOXL, TECL, and CURE. In the Stops & Targets model we are out of SOXL, and have full positions in TECL and CURE.
The SPY closed the week up +0.73%. The ETF Sector Plus model was up +4.14%. The ETF Sector Plus Strategy is up +50.96% year-to-date compared to its benchmark, the SPY, which is now up +8.60% year-to-date.
This Week’s Strategy Lesson: Measuring Your Model (Part 2 of 3)

Last week we covered the importance of many of the “headline” performance numbers including total returns, comparing returns to a relevant benchmark, and equity drawdowns. This week we are going to cover some key trading stats. The ETF models are portfolios, but they can also be thought of as a curated collection of trades with the benefits of global diversification and reinvesting profits to further improve returns. Thinking this way allows us to “zoom in” on the model and look at how individual trades tend to perform.
Win/Loss Percentage
This statistic simply computes the percentage of winning and losing trades. If 100 trades occurred and 60 of them were closed for a positive total return and 40 for a loss, then 60% of trades were winners and 40% were losing trades.
On its own, this statistic doesn’t tell you everything you need to know as you need the average profitability of different trades before you can compute the profitability of a system. A system can have a really high win percentage but low profits or even losses if the amount you’re making on those trades are lopsided.
If a trading system has a one-for-one risk profile, you want to see a really high win percentage to actually make money. Whereas a system where you make two, three, or four times as much on a wining trade as a losing trade can be quite profitable at a 50/50 win/loss trading percentage or even lower.
Winning Average Gain / Losing Average Loss
As we covered in the previous section, this set of statistics in coordination with the win/loss trade percentage is what empowers us to make solid conclusions about the profitability and trading characteristics of the models. Psychologically, it’s easier to trade a system where you make significantly more on winning trades than you lose on losing trades. Even profitable systems can be hard to trade if your risk on any given trade feels extraordinary.
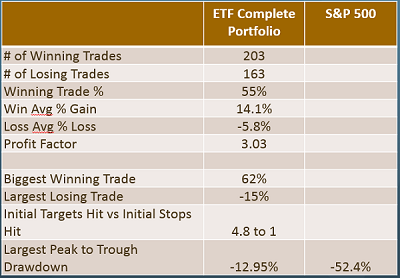
The ETF Complete Portfolio, which combines the performance of the three component models, has a 55% winning trade percentage and the average winning trade makes 14.1% while the average losing trade loses 5.8%. The individual component models all have trade statistics of a similar vein.
Profit Factor
This is the statistic that combines our previous two metrics to try and put an overall profitability stamp on the model. It is calculated simply by taking gross wins and dividing them against gross losses. A profit factor of “1” is a baseline breakeven system, meaning that for every dollar the system makes it loses one dollar.
Generally the higher the profit factor the better. This statistic should not be used in a vacuum, though, as you wouldn’t necessarily want to trade a system with a very high profit factor that made almost all of profits on a few rare or lucky trades. That is why all of the statistics are still used and displayed. The ETF Complete Portfolio has a profit factor just over three.
Largest Winning and Losing Trade
The largest winning trade can help you identify if the profits of a system are disproportionately coming from one or a few large trades. Systems that use defined stops and targets will tend to have trade outcomes that are more uniformly distributed. While we use a little different stop and target for the country model compared to the sector and global macro models, they all have similar proportionality. So with 25%, 60%, and 100% targets in the sector model, that works out to about a 62% total return on a trade that made it all the way to the final profit target. Not coincidentally, 62% is the largest winning trade in that model.
And symmetrically, 15% is the largest initial stop in any of the ETF models and is also the largest losing trade. 15% may seem steep but that loss would only be on a small portion of your portfolio, depending on if you are trading just the sector, country, or complete portfolios and is rarely hit (around 5% of all our trades were stopped out at the initial stop level).
These statistics help us both decide if a trading system is worthwhile and understand what we can expect to experience trading the model. This is important because keeping our expectations in-line with reality can help us stick with a system and know when a system is behaving in usual or unusual ways.
Next week we will cover some of the more exotic measures of risk like the Sharpe Ratio, standard deviation, and correlation.
The Current Condition of the Model
For the Sector model, we are in SOXL, TECL, and CURE. The SPY moved from the low end of its range to put in a new high and close towards the top of this trading range. All three of our holdings closed higher this week and maintain a firm hold on the top three spots. No position changes are imminent but stay tuned to the daily updates should any position change.
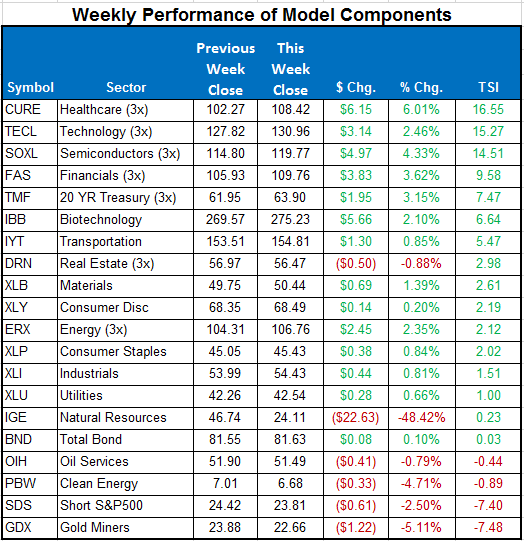
Here is a summary of the weekly performance of all the ETFs that the strategy monitors:
Best wishes for your trading,
James Kimball
Trader & Analyst
MarketGauge
