We exited our TECL position this week for a 6.75% gain and rotated into SOXL. Our three positions in the basic model are CURE, FAS, and SOXL while the Stops & Targets model is only in FAS, SOXL, and Cash.

This Week’s Strategy Lesson: Trend Strength Indicator (Part 1)

There are a lot of component parts that go into making the ETF models: custom selections of ETFs, rules regarding holding three positions, and the money management and stops and targets. However, at the core, the model is based around our Trend Strength Indicator and the key role that it plays in determining which ETFs we will hold. Let’s take a deeper look at it.
Finding a Trend
The central thesis of the ETF models is that you can outperform the market by holding the ETFs that are in the strongest trends. There are many different ways you could use to calculate trend strength.
Relative Strength (RSI) is very popular. That tends to look at short term price movements (often 10 or 20 days) and calculate if a stock or ETF is making more up closes or down closes over a given period and use the relative strength of those moves to determine if it might be “overbought” or “oversold,” meaning the move could be growing tired. This, however, doesn’t truly calculate trend strength in the sense we are using it.
Many people use technical analysis, moving averages, or trend lines to identify possible trends and determine where a stock or ETF move might take it based on support and resistance levels.
We have an ETF monitor product that compiles lists of ETFs and ranks them based on their absolute percentage gain over the last six months or three months.
Trend Strength Indicator (TSI)
Our ETF models use a similar concept to the price change over a given period, however we have added some refinements. The actual TSI calculation uses proprietarily weighted returns from multiple time frames including six months. These custom weightings end up feeding a lot more data into the calculation then a simple one-period price change and by that measure it can smooth out some of the distortions from other methods of calculation it.
We also use the TSI a little differently. Once the number is calculated we focus on comparing the relative TSI values of a basket of ETFs to determine a ranking and then use that ranking to determine our holdings.
The TSI is also a “diminishing” value, meaning that if an ETF made a big up move and then went sideways for a few months, you would see the initial score rise with the up move and then slowly fade back to zero or go negative if the ETF started moving back down.

You can see this in the chart above. From July through October 2011 the treasuries made a big move and you can see the TSI score (red line in the sub graph) chasing it up. But from October 2011 to March 2012 the treasuries were basically chopping sideways and the TSI score is slowly depreciating back to zero.
There are potentially a lot of other uses for the TSI. If you just looked at comparing two different ETFs, SPY and SH (non-leveraged short SPY ETF) and used a simple rule that you would hold the SPY when its TSI was greater than SH or rotate into SH when it had a higher TSI score you could have completely avoided the draw 50%+ drawdown from the financial crises of 2008.

Here we see this simple rule would have netted you up almost 50% vs being down almost 20% if you had held either individually during the whole period. Add a few profit targets to your SH position and you could have avoided some of the extreme volatility and ended with even higher performance.
Next week we will look a little deeper at the interplay between our holdings and the underlying changes in the TSI ranking that drives our position changes.
The Current Condition of the Model
The SPY put in a new intra-day high on Friday after a stellar jobs report. Our holdings, CURE, FAS, and SOXL each had great weeks and are on new all-time highs. It will be interesting to see how much more fuel to the upside this market has in the short-term.
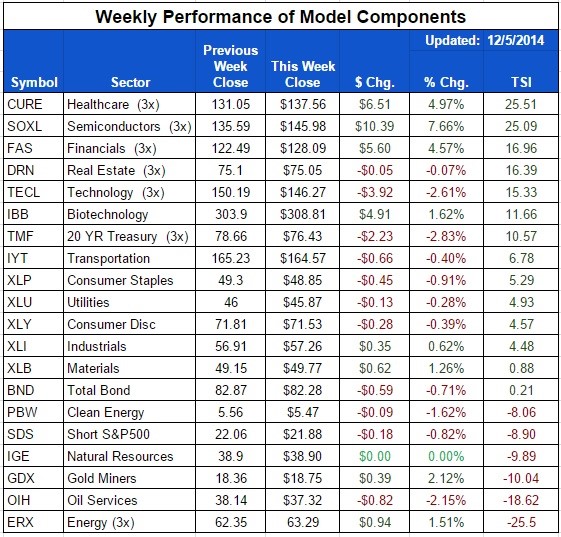
Here is a summary of the weekly performance of all the ETFs that the strategy monitors:
Best wishes for your trading,
James Kimball
Trader & Analyst
MarketGauge
