This week we issued one change in the model. On Monday evening we initiated a signal to replace CURE with ERX on the open Tuesday. We closed out our CURE position with a 12.26% profit. To open next week, we will be in SOXL, ERX, and DRN.
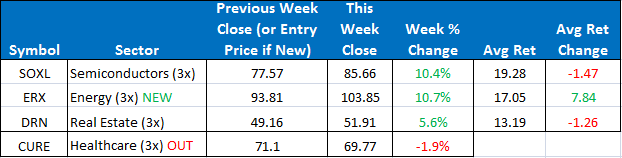
The SPY rebounded from last week’s lows to close the week up +2.64%. The ETF model also made quite a comeback ending the week up +7.66%. Semiconductors rebounded 10%. Energy was the hottest sector last week and our addition of ERX into our portfolio proved to be a great addition so far—up 10.7% since our entry. The ETF Sector Plus Strategy is up +14.18% year-to-date compared to the SPY which is up +0.87%.
This Week’s Strategy Lesson: Using the Trade Tracking Tool (Part 2)
Two weeks ago I started a three part series on how to use the trade tracking excel spreadsheet that was designed to help people track their trades and follow the model portfolio. I will continue the series this week with a section on keeping track of your open and closed trades P&L.
A quick review: The ETF Sector Plus model generates trading signals at the close of the market and then executes trades, if any, through market orders at the open of trading the following day. Typically, we are always in three roughly equal-weighted positions. When we have a new trading signal, we sell out of an existing position and enter a new position with the same cash value as the one we exited.
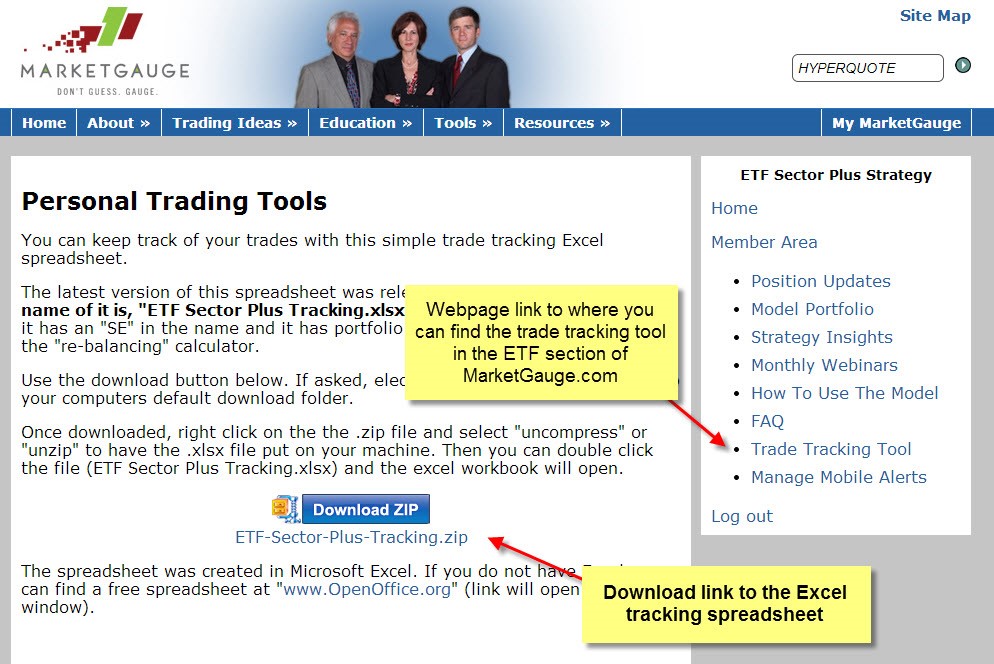
The Trade Tracking tool can be downloaded from the marketgauge.com website once you log into the ETF Sector Plus section. It is a Microsoft Excel file. We have a similar version for Open Office, a free spreadsheet program.
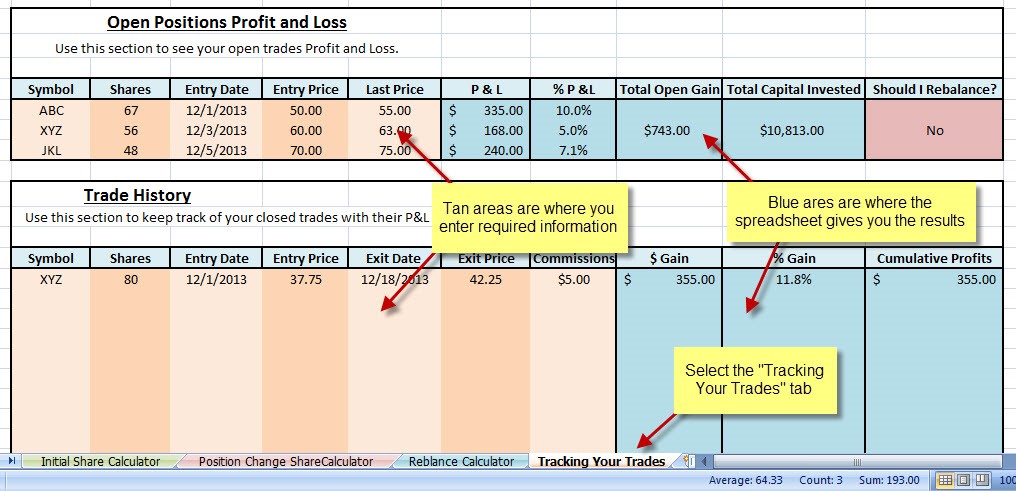
I am going to go over using the “Tracking Your Trades” section. It is one of four tools/calculators found in this spreadsheet. I stress that these are optional tools that can help you follow the model. Many of these calculations are fairly basic math and can be easily done on a calculator or with pen and paper. One thing to note, the spreadsheet has been designed so the tan colored boxes are where you type in required inputs and the blue colored boxes are where the spreadsheet gives you the outputs or actions to take.
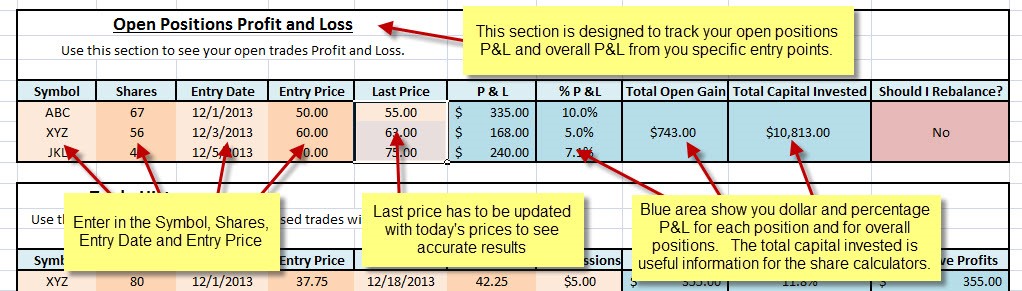
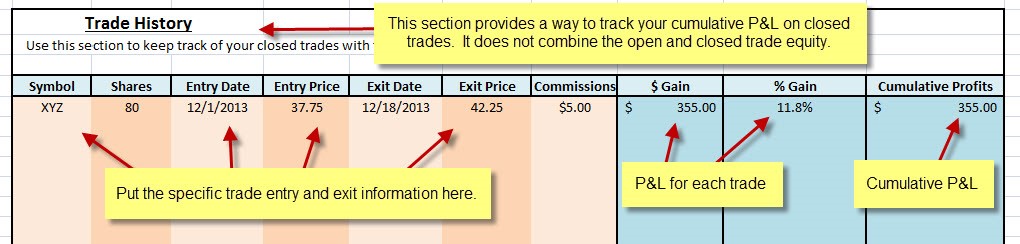
This section has two parts. The top section tracks the P&L of your open trades. The bottom section can keep track of all of your closed trades and the cumulative P&L from those trades. For the top section, enter in the symbol, share numbers, entry date and entry price into the tan section. This will only have to be done once per trade. In the “last price” column, you can update the latest market prices whenever you want to see the latest P&L. This can be done daily or whenever you wish to evaluate the open P&L. The results are displayed in the blue section. I will cover the rebalance functionality in the next installment of this series. These tools are optional and any brokerage platform should track your open P&L.
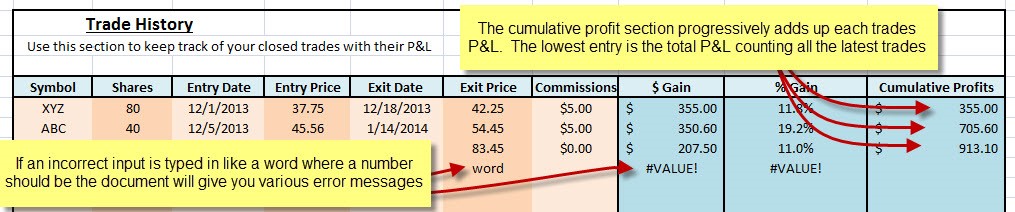
The trade history section allows you to track the P&L of your closed trades. Again, specific trade data is entered into the tan sections and the blue section calculates and tracks the dollar and percentage gain for each trade and progressively adds them up in the cumulative profits column. One thing to note is that if an improper entry is made, like text where the calculator is expecting numbers, the calculator can return varies error messages. Displayed below is the “#VALUE!” message because the exit price was invalid.
In the next installment of this series, I will be covering the rebalance calculator and going into greater detail about how the model handles adjusting position sizing to remain equally diversified in our three holdings. If you haven’t already had a chance to watch the live training webinar, you can see a quick video demo of the trade tracking calculator available at the following link:
https://marketgauge.com/education/etf-sector-plus-strategy/monthly-webinars/
For the model, we will open next week with SOXL, ERX, and DRN. Our three holdings performed very well this week as the broader market bounced off its lows.
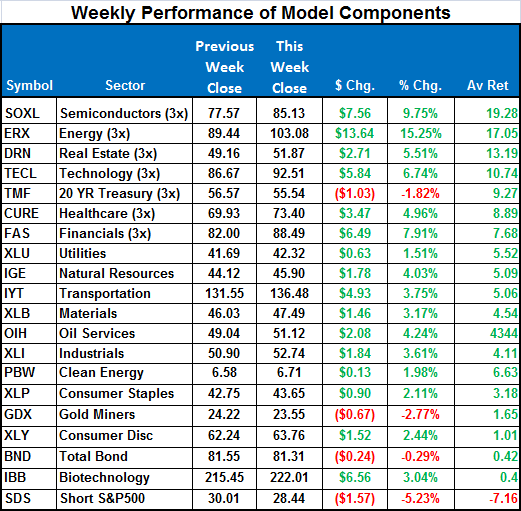
Here is a summary of the weekly performance of all the ETFs that the strategy monitors:
Best wishes for your trading,
James Kimball
Trader & Analyst
MarketGauge
