This week we issued one change in the model. On Friday evening we initiated a signal to replace TECL with DRN on the open Monday. To open next week, we will be in SOXL, CURE, and DRN.
The SPY closed the week up +0.4%. The ETF model was up +0.5% for the week. Despite the major selloff in the indices on Friday (and the leveraged ETFs taking it on the chin) we managed to end the week positive. The model can have this type of volatility. That’s why it’s important to be position sized to stick with it. The ETF Sector Plus Strategy is up +12.9% year-to-date compared to the SPY which is up +1.3%.
This Week’s Strategy Lesson: Using the Trade Tracking Tool (Part 1)
This week we had our ETF Sector Plus live training webinar. In addition to looking at some of the macroeconomic and ETF trends, we spent a little time going over some of the mechanics of trading the system. Given many of the questions we are being asked, I think it’s important to spend a little time explaining the process and some of the tools we have provided to help you follow the system. I will be providing here the first part of a short series of tutorials on how to use the trade tracking spreadsheet.
Just for a quick review: The ETF Sector Plus model generates the trading signals at the close of the market and then executes trades, if any, through market orders at the open of trading the following day. Typically, we are always in three roughly equal-weighted positions. When we have a new trading signal, we sell out of an existing position and enter a new position with the same cash value as the one we exited.
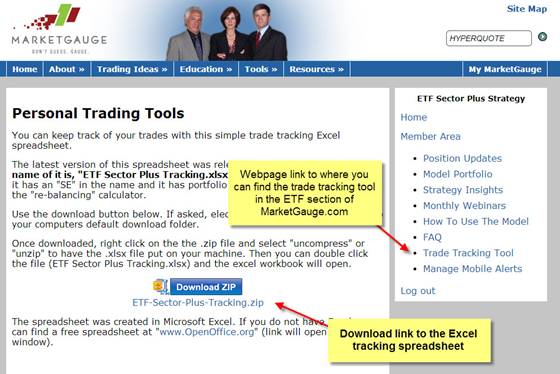
The Trade Tracking tool can be downloaded from the marketgauge.com website once you log into the ETF Sector Plus section. It is a Microsoft Excel file. We have a similar version for Open Office, a free spreadsheet program.
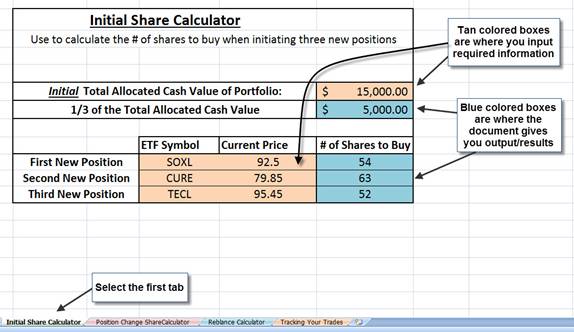
I am going to go over using the initial share calculator. It is one of four tools/calculators found in this spreadsheet. I stress that these are optional tools that can help you follow the model. Many of these calculations are fairly basic math and can be easily done on a calculator or with pen and paper. One thing to note, the spreadsheet has been designed so the tan colored boxes are where you type in required inputs and the blue colored boxes are where the spreadsheet gives you the outputs or actions to take.
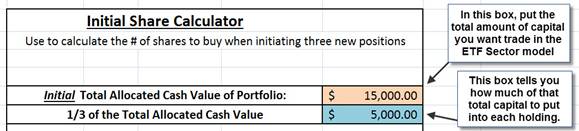
The first step for this calculator is to put in the tan box above the amount of capital you are going to use to trade the ETF Sector Plus model. The blue output box merely divides that number into thirds, giving you how much cash value to buy of each of three ETFs.
In the lower section of the initial share calculator, you can then put in the ETF symbol name and its current price (or entry price/open price for the day). Right beside that, are blue output boxes that tell you how many shares of each ETF to buy so that you can have equal cash value positions in the three ETFs.
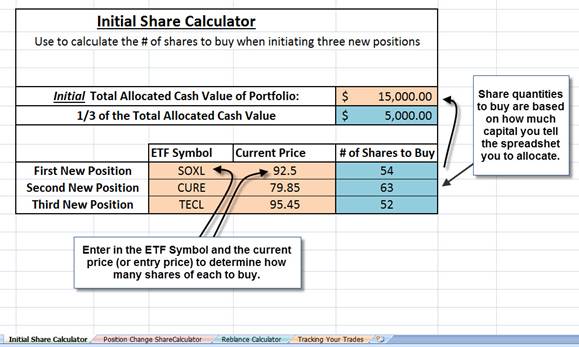
This calculation just divides the 1/3 capital allocation by the current share price to tell you how many shares need to be purchased to get the equal cash value positions.
This is only the first of a few tools that I will be explaining. If you have a chance to watch the live training webinar, you can see a quick video demo of the initial share calculator. This webinar should available shortly at the following link: Monthly Webinars
The Current Conditions of the Model
For the model, we will open next week with SOXL, CURE, and place a market order to replace TECL with DRN. This week was a good example of some of the volatility of the model. But it came alongside outsized moves in the broader market. On Friday, the SPY gapped open to R2 and ended the day near S3.
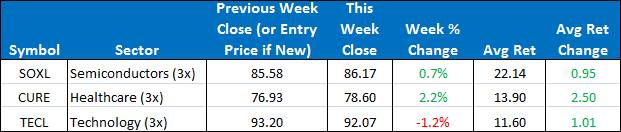
Here is a summary of the weekly performance of all the ETFs that the strategy monitors:

