| When we traded on the New York Commodities Exchanges, we learned that the typical indicators one relies on, become meaningless when certain factors overtake logic.
Traders can buy up a commodity future ignoring technical resistance, overbought strength indicators and Fibonacci numbers.
A commodity such as oil, for example, can go limit up for days.
Back in September 1990, once the Persian Gulf War began, crude oil futures ran from $17 a barrel to $29 in a few days.
By October, the price traded to $35.00.
By November, it continued to run to $40 a barrel, just before the big sell-off back down to $28.00
In the last month, oil futures traded from $49 up to 57.60.
Several factors account for the rally.
The most recent news story involves the arrest of Saudi Princes.
Naturally, I see droves of analysts calling for a top of this move.
They point out pivot points and overbought RSI’s.
And, they could be correct.
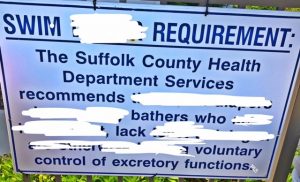
Yet, bathers who lack voluntary control of certain functions, like traders who sense a melt-up, find that the weak longs empty out of the pool leaving them plenty of room to swim.
Should new longs heed the County Health Department recommendations?
Currently, the oil rally may have precipitated what could be, the moment I have been waiting for.
A few weeks ago, I wrote about the historically low ratio between equities and commodities.
“The ratio between the performance of commodities versus stocks has only been this low twice in the last 100 years.”
Furthermore, equities have enough diversion to suggest the ratio already has begun to narrow.
Transportation IYT, is holding the 50-DMA although remains under the monthly channel top.
One sign of over bloated equities would come from this sector, should it sell off more.
The Russell 2000 (IWM), after having 2 inside days in a row, needed to close over 148.96 as a start to show commitment from the longs.
Closing price: 148.82
Granny Retail (XRT) tried and tried to clear 40.00. Even with Michael Kors rallying 15%, XRT could not make it.
That market is relying almost solely on Semiconductors, NASDAQ and FANG stocks.
They could still do the heavy lifting and have. However, I can tell you that the other Economic Modern Family sectors must also jump in the pool.
Today, Biotechnology (IBB), already in a warning phase, did not do much to attract any new speculators.
These days, many Commodities have ETFs to trade instead of futures.
I suggest you check out USO, XOP, OIH and XLE for starters. Then, look at the metals, softs and agriculturals.
DBA and DBC, topics of my daily on October 10th, have already yielded 2 profit targets.
Swimmers-even if you prefer to wear a wetsuit-the time to bathe in the commodity pool is nigh.
S&P 500 (SPY) Another new all-time high Subscribers: Positive Pivots in all
Russell 2000 (IWM) Needs to clear 149.25 then really, 150. Hold 147
Dow (DIA) New all-time highs
Nasdaq (QQQ) New all-time highs-are you thinking Mish is nuts by now calling attention to commodities with all these new highs?
KRE (Regional Banks) 2 Inside days. 57.00 pivotal
SMH (Semiconductors) Yep, new all-time highs
IYT (Transportation) Back below the monthly channel on the new month-still best place to watch. 174.75 the 50-DMA
IBB (Biotechnology) 310 support held-now looking at 317 to clear, then 322.
XRT (Retail) Closed shy of 40.00. Not so good. Needs to hold 39.25. Over 40.50 is a decent long
IYR (Real Estate) Happy day here with the ease on rates. Unconfirmed bullish phase
GLD (Gold Trust) 119.75 support. If clears 122 good sign
SLV (Silver) 16.25 cleared.
GDX (Gold Miners) Needs to clear 23.10 with volume
URA (Uranium) Subscribers: 12.32 fills a gap
USO (US Oil Fund) 10.80 now support
XLE (Sel Energy Spdr Fd) Cleared the 50-week MA with conviction
OIH (Oil Service Holders) Lagging behind XLE with resistance coming up at 27.00
XOP (Oil & Gas Exploration) Cleared 35.52 the 50-week MA, which is a good risk point
UNG (US NatGas Fund) Subscribers: Resistance at 6.50
TAN (Solar Energy) Breakaway gap to start the week
TLT (iShares 20+ Year Treasuries) 6-day rally from recent lows into resistance-125.25 now pivotal support to hold
UUP (Dollar Bull) 24.37 the 200-week MA and 24.80 resistance
EEM (Emerging Markets) Subscribers: New 2017 highs
GREK (Greece) Subscribers: Doing ok
EWZ (Brazil) Subscribers: Like this now that it confirmed a reversal. Risk to Friday’s lows
ILF (Latin America) Subscribers: Similar looking to EWZ
WEAT (Teucrium Wheat Fund): Subscribers: It held 6.24 so it closed back inside the channel-I will not officially recommend this but unofficially, that is good news to me
SOYB (Soybeans) Inside day and one push more will clear the 50-week MA
DBA (PwrShs DB Ag Fd) Subscribers: 19.30 pivotal
DBC (DB Commodity Idx Tracking Fund) Subscribers: Likes the oil move-second target near
SGG (Sugar) Subscribers: Like over 30.20
JO (Coffee) Subscribers: 16.31 needs to clear after 2-inside days |