Opp Report Demo

January 7, 2026

Uncategorized

By Lincoln Oehlers


Broadcom Inc. (AVGO)

Industry / Sector: Semiconductors / Technology

Data as of: December 9, 2025

EPS Due: 12/11

Avg. True Range (ATR): $7.56

Last Price: 195.47 +2.15  +1.97%  %Vol: +37%

MarketGauge Technical Rating

Short-Term
(1–5 days)
★★★★★
Intermediate
(1–6 weeks)
★★★★★
Long-Term
(2–6+ months)
★★★★★

Trade Alert Status: Active Position:

Current Position: Long Entered on 2025-12-29 and $74.75

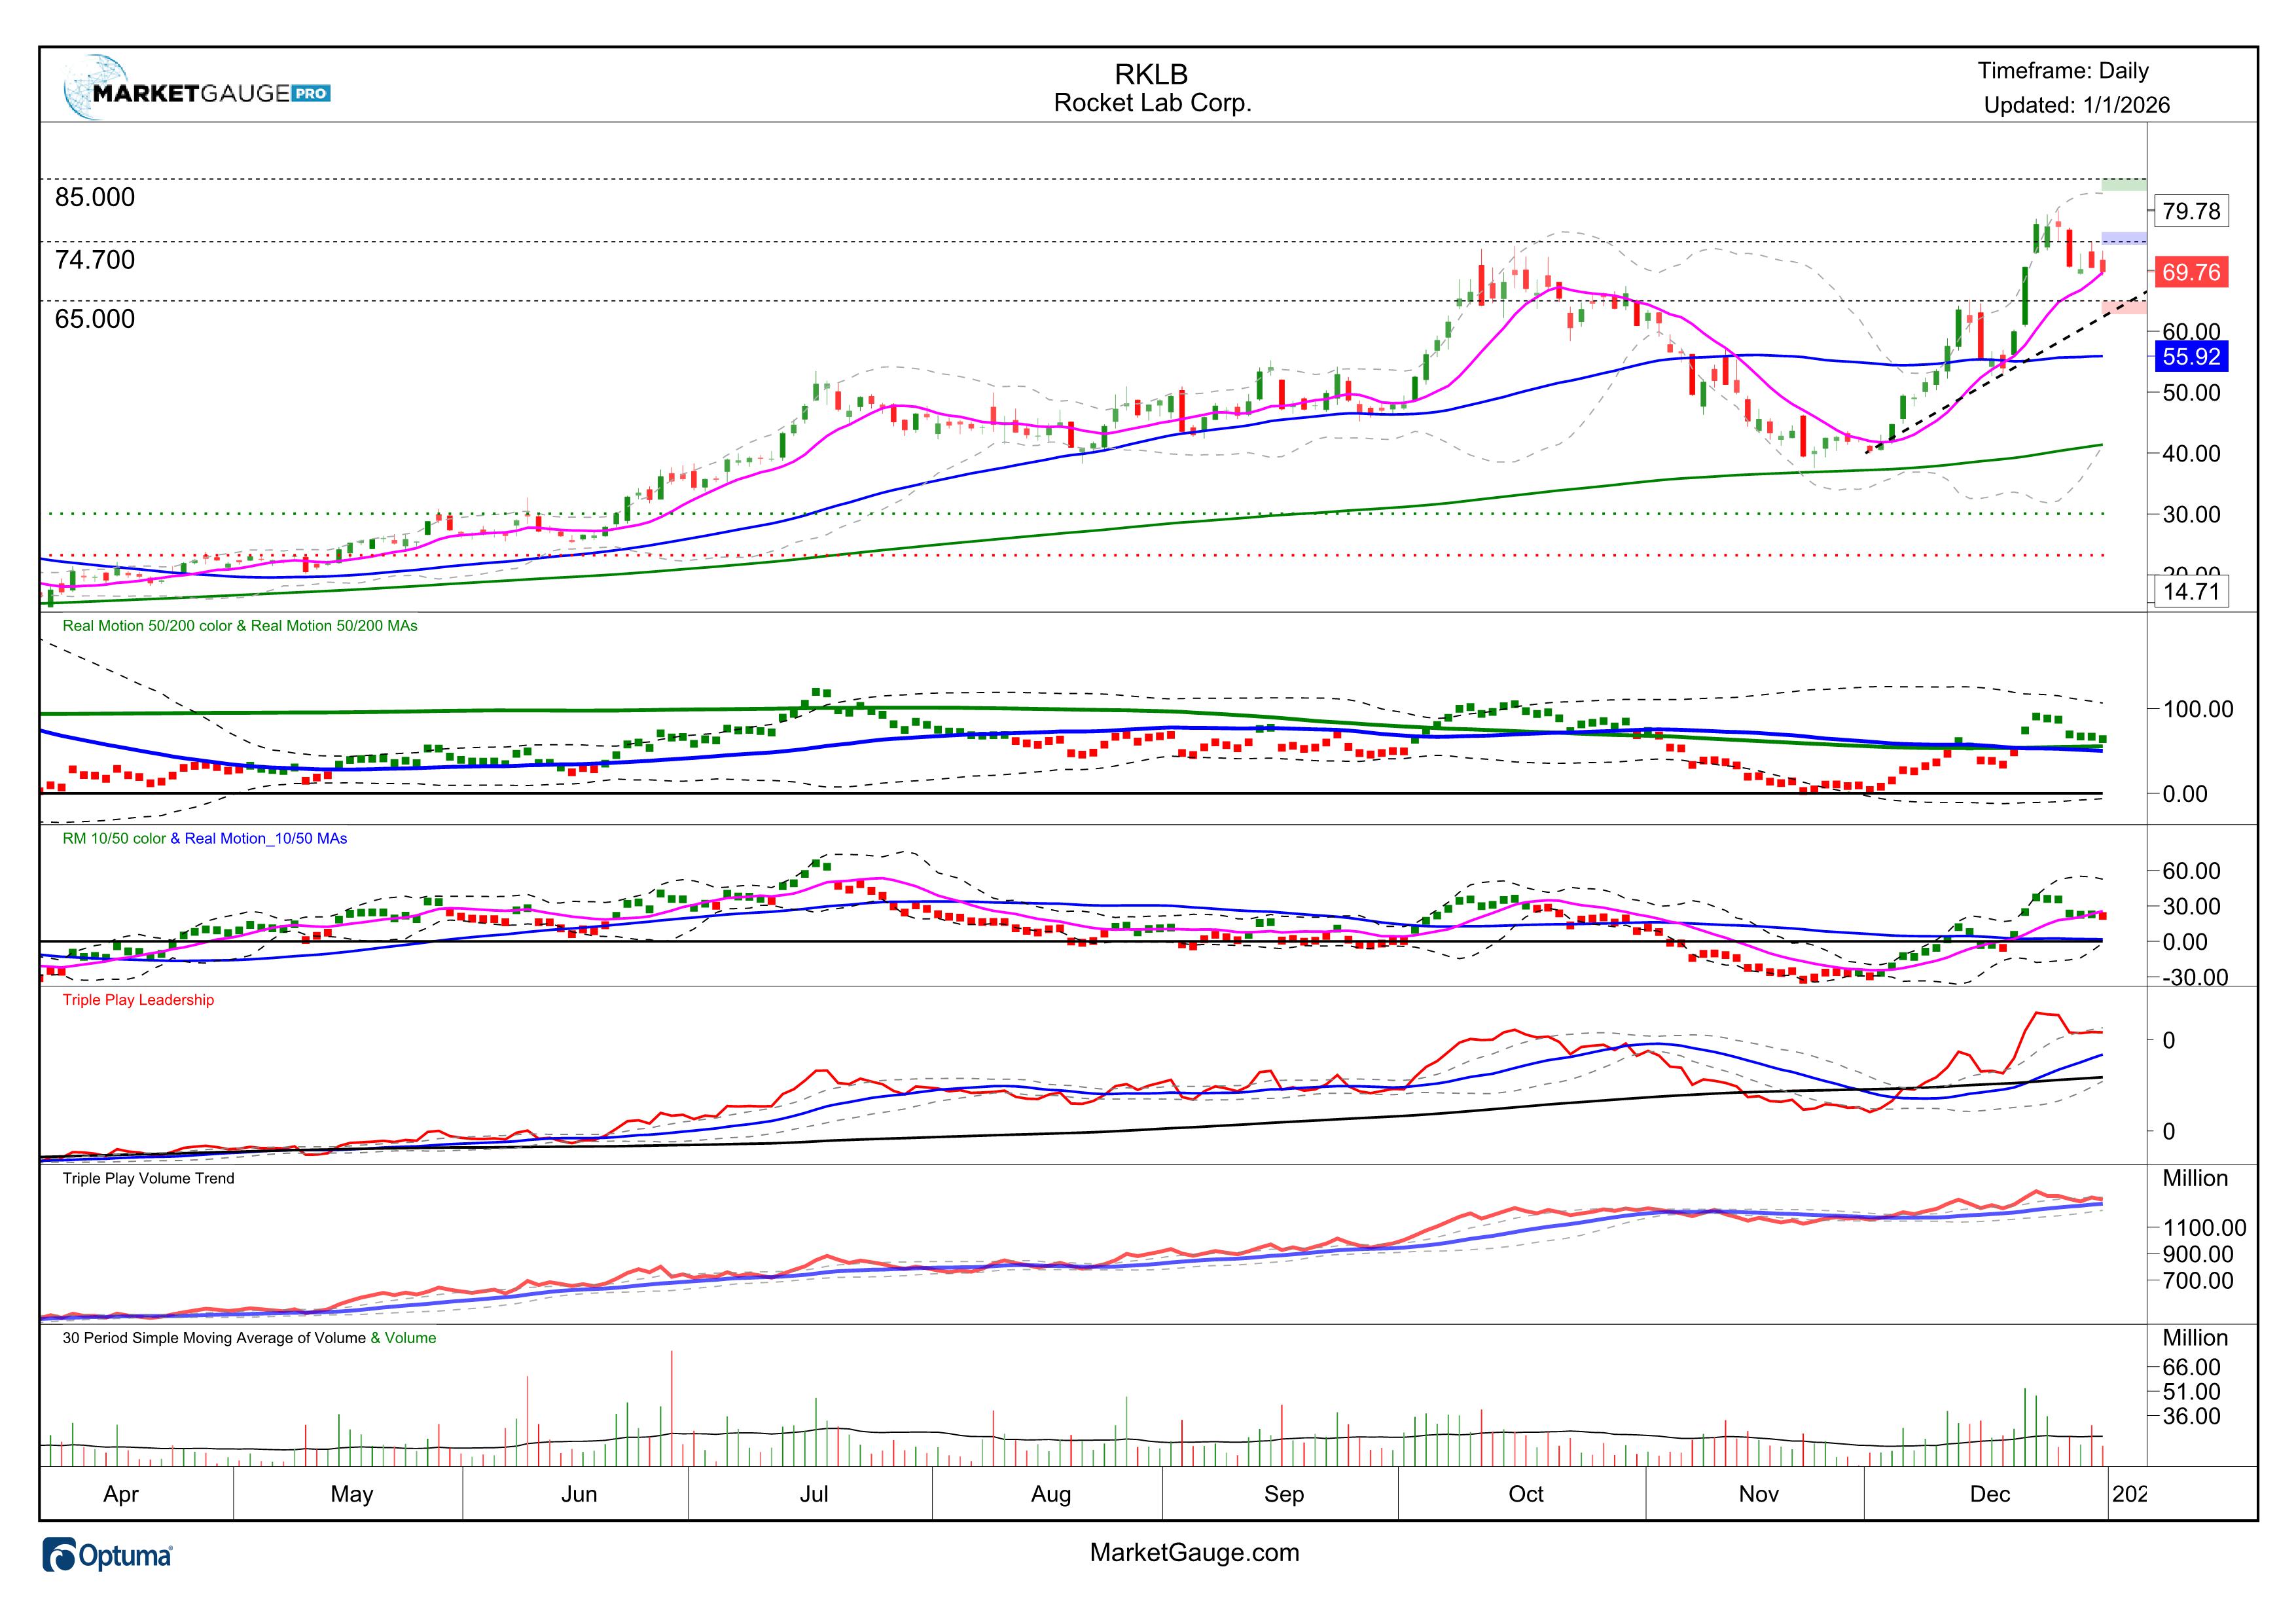
Trading Ideas & Actionable Price Zones:

Trade Time Frame: Intermediate (1-6 weeks)

Buy Zone: $75.00 to $76.00

Inflection Point: $74.69

Flag breakout on the 10-DMA. Initial buy over 12/30 high 

Risk (Stop Out Zone): $63.00 to $65.00

Inflection Point: $65.18

Key support under the 10-DMA is the 12/12 swing high at 65. This is a wide stop for sizing up a potential trade before the low of the flag has been determined.

Target 1: $84.00 to $85.00

This 2 ATR target is equal to the risk, and it would exceed the 79.78 high by enough to assume a no-loss stop should not get hit.

Trade Notes:

** For more specific trading tactics for entering, exiting, and taking profits, attend the live mentoring or review the recordings **


Company Description

Broadcom Inc. (ticker AVGO) is a U.S. technology company in the semiconductors and infrastructure software sector. It designs, develops, and supplies a wide range of semiconductor devices, networking chips, custom AI accelerators and infrastructure software solutions for data centers, enterprise networks, broadband, wireless and storage markets. Headquartered in San Jose, California, Broadcom operates two main segments —

Earnings Surprise Summary

EPS Due: Feb 25 · After Hours

DATE EPS SURPRISE
Nov 10 $-0.03  -70.00%
Aug 7 $-0.13  +18.18%
May 8 $-0.07  -22.22%

Short-Term Trend Analysis (1–5 days)

Overview

Short-term price slipped under the 10-DMA while momentum also flattened. RM (50) shows bearish
divergence against its moving averages, implying short-term momentum is lagging despite generally
strong medium and long-term price trends. Triple Play highlights mild leadership fatigue and neutral
volume behavior, reinforcing the idea of consolidation rather than renewed upside acceleration.

Price Trend

The short-term price trend is currently weakening modestly below the 10-DMA, with the 10-DMA still
rising.

  • Price is under the 10‑DMA, indicating near-term weakness.
  • The 10‑DMA remains upward-sloped, reflecting underlying trend support.
  • Price has been moving lower for several consecutive sessions.
  • Because price is close to but below the 10‑DMA, this marks a short-term testing area that may
    act as near-term support or resistance.

Real Motion

RM (50) deteriorated as its dot fell below both fast(10) and slow(50) RM MAs, confirming bearish
short-term momentum.

  • RM (50) dot sits below its fast(10) RM MA and slow(50) RM MA, reflecting momentum weakness.
  • There is a well‑established bearish divergence (5+ days) between the RM (50) dot and
    the slow(50) RM MA.
  • A well‑established bearish MA divergence (10+ days) indicates RM (50)’s MA structure
    lags underlying price MAs.
  • These divergences imply lagging momentum relative to price and suggest caution as price tests
    the 10‑DMA.
  • RM (50)’s behavior currently contradicts the short-term price bias and could lead near-term
    weakness if persistence continues.

Triple Play

Leadership momentum has softened while volume participation stays moderate.

  • Leadership: The short-term price rating remains positive but with a bearish
    divergence warning, suggesting recent leadership strength is fading.
  • Leadership trend shows flattening; no upper-band breaks, implying consolidation.
  • Volume: Neutral-to-slightly positive volume trend; no volume surges or extremes
    were noted.

EXPAND ANALYSIS

Intermediate-Term Trend Analysis (2–4 weeks)

Overview

Intermediate-term price action remains bullish above the 50-DMA, with both the 10- and 50-DMA
trending higher. However, the RM (50) divergence shows momentum has not confirmed the price
breakout—marking a potential inflection point. Triple Play midline metrics reflect stabilizing
leadership but limited new inflow confirmation from volume.

Price Trend

Intermediate-term trend remains structurally strong, supported by a rising 50-DMA and the 10-DMA
stacked above it.

  • Price is above the 50‑DMA, confirming bullish intermediate trend.
  • The 50‑DMA is rising, showing trend strength.
  • The 10‑DMA is above the 50‑DMA, a structurally healthy formation.
  • Since price was near the 10‑DMA recently while RM (50) shows divergence, this zone can act as an
    intermediate-term inflection zone.

Real Motion

RM (50) momentum is below both the slow(50) RM MA and its own fast MA structure, confirming bearish
intermediate-term divergence.

  • RM (50) dot resides below its slow(50) RM MA—bearish intermediate bias.
  • fast(10) RM MA is also below slow(50) RM MA—indicating weak RM (50) structure.
  • A well‑established bearish divergence (5 days) between the RM (50) dot and slow(50) RM
    MA suggests sustained momentum lag.
  • A well‑established bearish MA divergence (10+ days) between RM MAs and price structure
    highlights that RM momentum lags price trend.
  • RM (50) thus contradicts the intermediate bullish price trend and warns of potential stalling at
    current levels.

Triple Play

Intermediate-term leadership and volume readings remain supportive but not aggressively bullish.

  • Leadership midline sits modestly above its long-term average for several weeks (bias =
    positive).
  • Leadership midline slope has flattened, marking consolidation.
  • Volume midline slope is neutral, showing balanced accumulation/distribution with no momentum
    surge.

EXPAND
ANALYSIS

Long-Term Trend Analysis (2–6 months)

Overview

Apple’s long-term structure is firmly bullish: the market phase remains Bullish with price
above rising 50‑ and 200‑day moving averages. However, long-term RM (200) momentum is beginning to
decrease, showing weakening acceleration even as price trends remain positive.

Price Trend

The current market phase is Bullish, consistent over the past five bars. Price sits
well above the 200‑DMA with both the 50‑ and 200‑DMAs rising.

  • Price is above the 200‑DMA, reflecting a bullish structure.

EXPAND
ANALYSIS