January 21, 2013
Uncategorized
By Geoff Bysshe
I added a new column to the HotScans screenshot displays because it makes it very easy to see whether the stock gapped and by how much. The last 2 columns on the right now display the stock's gap in terms of dollars and percent change.
I underlined COL as a good illustration of how this display can show that the stock gapped higher by 2% but then fell intra-day by 3.9% to close down on the day by 1.9%. These price changes are displayed in the columns labeled "Previous Per. % Price Chg.", "Since Open % Price Chg." and "Today's % Price Change" respectively.
There are a number of stocks worth keeping an eye on going forward. For example, it will be interesting to see if COF's gap down marks a bottom since it landed on a big area of support and including the 200-day moving average. COL's reversal looks like topping action and comes at a key swing high area.
If you are a HotScans member, starting this week you will find each day's stocks listed as a pre-defined portfolio named "1MG_...". Additionally, you can click on this link to bring up the list of stocks shown below and customize your filters and views:
Click here for the current data for the 1/18 earnings stocks
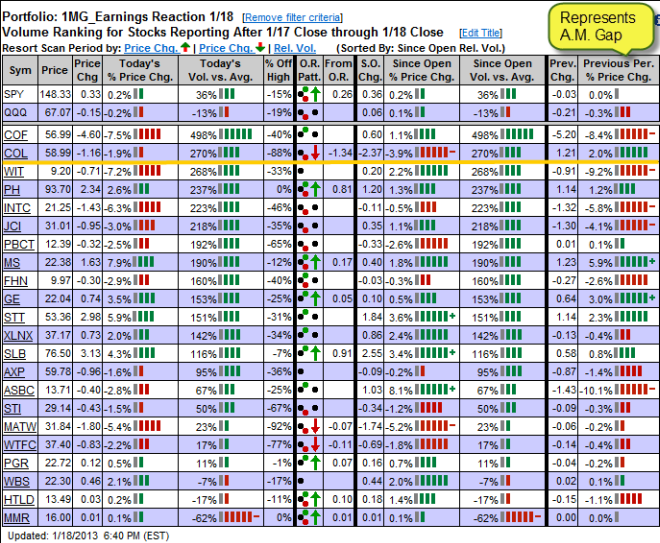
This screenshot above is taken from HotScans as of the close on 1/18. It displays the top 25 stocks that reported earnings from the close of the day prior to 1/18 through the close of 1/18 so you can see the stocks reaction to their earnings in the first trading session after they reported.
Click the image below for a quick video tutorial on how to get the most out of this data.