January 11, 2026
Weekly Market Outlook
By Geoff Bysshe

While most analysts and the media are focused on the 2 primary market-driving economic data points, the labor market and inflation, there’s another series that will likely determine how the market responds to employment and inflation data in 2026.
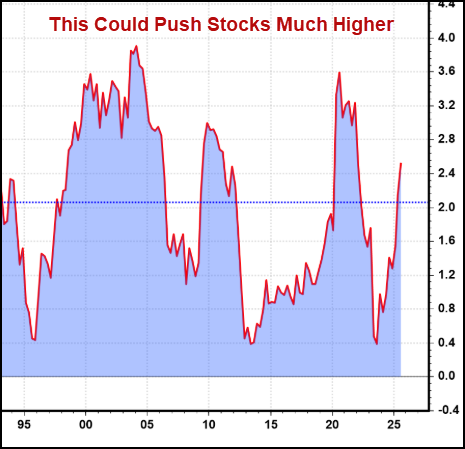
Ironically, few investors are talking about it. Some are even denying it’s real, but as you can see in the chart below, it’s taking off and could push stocks much higher for years, just like it did in the late 1990’s.
However, one data series (that doesn’t get a lot of attention) isn’t going to fuel a bull market alone. So, before we dive into this obscure economic data, let’s review the economic data that is on investors' minds.
Two weeks ago, in this column titled ”The New Bull Market Formula How to Keep The Bull Market Strong,” I outlined a framework for identifying stocks that are most likely to experience a strong bull trend. At the core of that framework is the belief that it takes several different kinds of trends to align to get a big move.
While those same characteristics can be used to anticipate the moves in the equity indexes, there is a similar framework that can be applied to understanding “what kind of economy” we’re experiencing. Different flavors of economic growth will have different outcomes for the stock market.
This is why the market is so focused on the “nuance” of the labor market being described as a “no hire, low fire” weakness versus a labor market where firing and layoffs are the focus.
As always, I’ll suggest that this nuance is less important than how the market reacts to the labor data report. So let’s start there.
Was Friday’s Unemployment Data Bullish?
Last week, the market focused on the employment report. The labor market is the biggest reason the Fed would continue cutting rates. The immediate response to the unemployment rate being slightly better than expected (lower) led many market strategists to conclude that the Fed would not lower rates in January.
In the recent past, such a conclusion would have likely sent stocks and bonds lower. Instead, the market’s initial premarket reaction was slightly positive.
A slightly higher open in the regular session was followed by a brief selloff, which tested the bulls' resolve and created the Opening Range reversal pattern (which we teach as a “how to buy the dip” strategy), and then rallied confidently into the afternoon.
In the afternoon, the broader indexes, IWM and RSP (S&P 500 equal-weighted), took a breather, while the big caps continued to climb for the rest of the day.
Friday’s trading pattern is one I wish all our members and readers knew well, as it offers low-risk entries for day traders, swing traders, and investors. It also gives you insight into the strength of the bigger trends – especially when it is a reaction to an important news event like last Friday.
It’s even more powerful when we’re in a bullish January Trend Trade condition, which was described as “what to watch out for” in last week’s Market Outlook titled “Watch Out For The Market’s 2026 Balancing Act.”
The January Trend trade is in full gear after last week, and this coming week it will hit an important milestone (we’ll discuss that below), but first…
I’ve explained Friday’s bullish intra-day pattern in the image below.

This Pattern Is Not Just For The Indexes!
Last week’s article highlighted Rocket Lab (RKLB) as a stock in a bullish condition, and almost every day last week, it had a version of the pattern above. Instead of gapping up and pulling back, it was pushed lower right on the open, but then found support around the OR Low and FTP zones and rallied for the rest of the day.
What’s So Important About Friday’s Bullish Response To The Unemployment Report?
The consensus of market strategists on Friday was that the Fed will not cut in January. With that narrative in the market, stocks rallied in a very bullish way. Why?
The market probably rallied for three reasons.
The January Trend Trade Gets More Bullish
Last week’s Market Outlook shared the following image with comments on the upcoming week, our January Trend trade would follow the direction of a breakout of the Friday, Jan. 2 range.
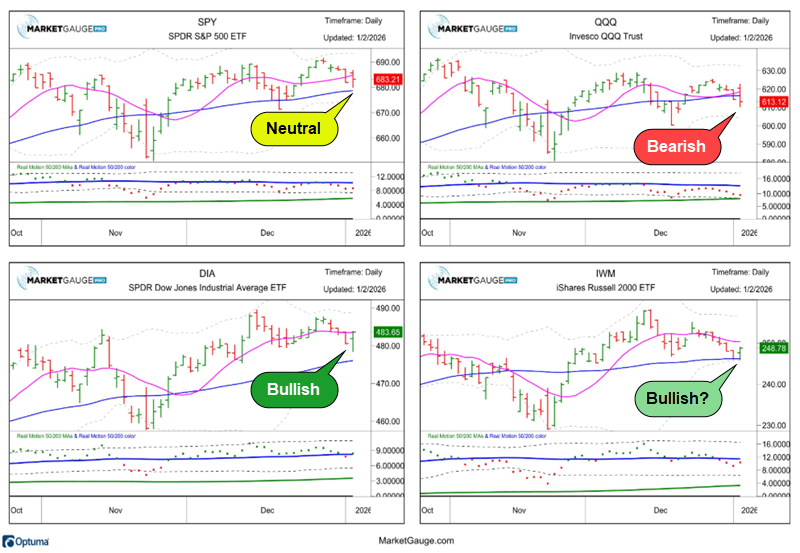
This week these charts show how the market has moved relative to that first day range.
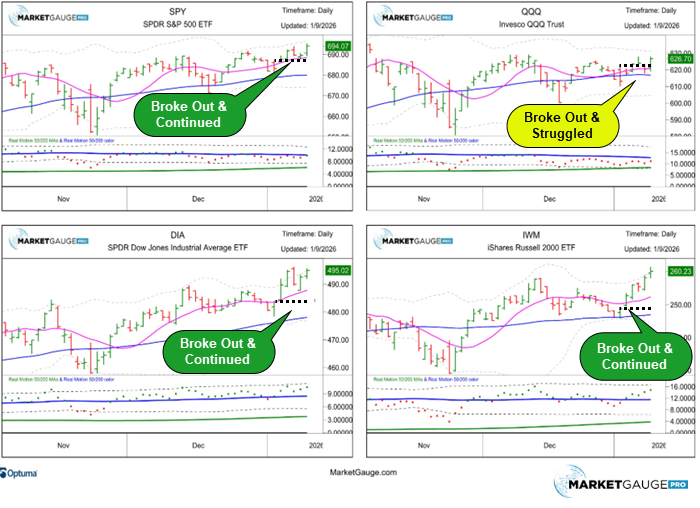
Some noteworthy observations:
What’s Next For The January Trade?
The January Trend Trade is just getting started. In fact, the big range that we will follow ALL YEAR will not be set until this Thursday.
On Thursday morning in our mentoring room, we will be looking at the stocks and sectors with January Calendar Ranges that are positioned for big moves.
It’s not uncommon for stocks that got off to a hot or bearish start to stall or reverse this week. We’ll look for those patterns to identify Calendar Range reversals and breakouts.
The simple application is to trade in the direction of the price trend relative to the range you’re focused on. The tactics are in knowing the best ranges and the confirmation rules for breakouts and reversals.
If you want to be a part of following this strategy, contact [email protected] or www.marketgauge.com/call.
The Economic Trend Investors Should Watch in 2026
Last week, Jonathan Levin, wrote a great article for Bloomberg on Productivity. It focused on the probable sources of the high rate of productivity in the economy and its potential impact on Fed Policy.
The economist side of me spent hours gathering data on this point, but the trader in me left it all on the cutting room floor to avoid complicating a simple relationship, since the market will ultimately tell us how to focus on this data.
There are several economic relationships that will determine the importance of reported “economic proactivity” in how it will impact stock prices, but those are details.
Jonathan summarized what I’d like emphasize here…
“The US economy seems to be in the throes of one of its biggest bursts of productivity in decades, weighing on business labor costs and hastening the disinflation process. If artificial intelligence is partly the reason for the gains, then it’s plausible that we’re in the early days of durable improvements to efficiency.”
This “burst” of productivity can be seen in the chart below, created by Ed Yardeni, one of the best market strategists on the street, who does a great job at following productivity as it relates to the market.
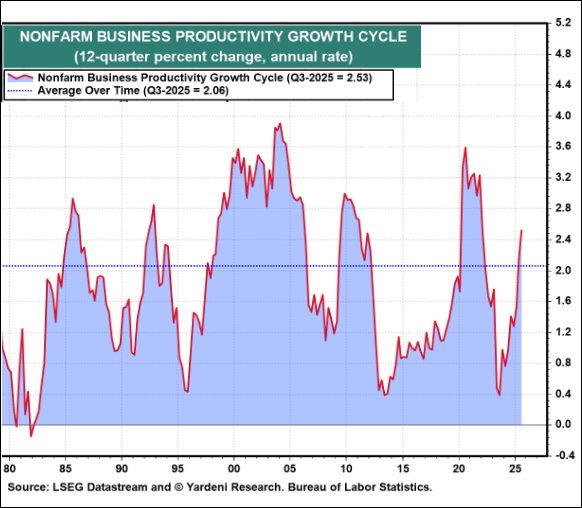
Note the acceleration during the early 1980’s (a huge bull market), then in the late 1990’s (dot com bull market), and now the similar trajectory (AI-driven bull market).
Warning: Increased productivity does not guarantee a bull market for several reasons.
However, one condition under which increased productivity will likely lead to a bull market is when its impact boosts corporate earnings.
“AI” is a very broad term used to describe many very different technologies, so it’s often hard to put it in a simple descriptive “box”. Considered AI to be a whole new category of technological tools that has already demonstrated its ability to reshape how we live, work, produce new physical products, develop new ideas, and more.
It’s undeniable that AI tools and technology can make a person much more productive. The charts above and below suggest that it is making the economy more productive.
The title of the chart below from Jonathan’s article suggests that the high productivity is “as good as it gets.”
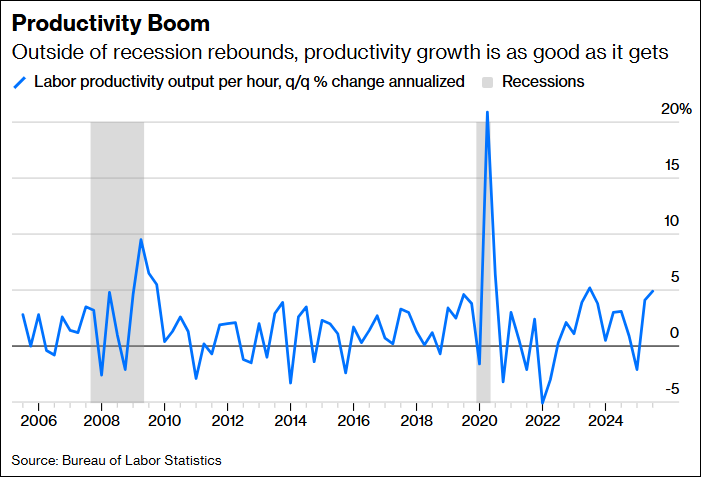
The math behind this calculation may make it difficult for this chart to “breakout” like a stock chart, but there is a very plausible way that this chart could get much better. All it has to do is stay at its current level. This wouldn’t just be better than as “good as it gets”, it would be exponentially better.
The simple reason to believe that we’re not at the end of an AI bubble (we may be in one), is demonstrated by the chart below (also from the Bloomberg article).

For all the hype in the media about AI, the productive use of it is extremely low relative to its near-term potential.
If the productivity data is as strong as it is at this point, given this level of AI adoption, there are much bigger gains ahead. These gains won’t always be announced in the media, but they’ll show up in earnings growth, better margins, more efficient cost structures, and more.
Several months ago, the market would have sold off on the prospect of the Fed slowing or pausing rate cuts.
Last Friday, stocks rallied like they were confident they'll deliver the earnings they'll need to keep the bull market going.
The 2026 market feels like watching a parent teaching a child how to ride a bike without training wheels for the first time. The market feels like it’s at the moment when the parent isn’t holding the bike, and the child is riding on his own without realizing it.
Let’s hope this earnings season doesn’t tip the market over.
If productivity is any indication, I think we’re in good shape.
If you'd like help taking advantage of the new bull market in 2026, contact us.
Best wishes for your trading,
Geoff Bysshe
 |
 Every week we review the big picture of the market's technical condition as seen through the lens of our Big View data charts. Every week we review the big picture of the market's technical condition as seen through the lens of our Big View data charts.
The bullets provide a quick summary organized by conditions we see as being risk-on, risk-off, or neutral. The video analysis dives deeper. |
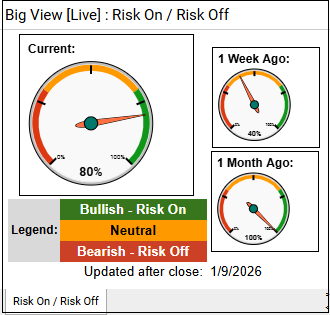
Summary: Overall risk-on conditions strengthened as major indexes pushed to new highs led by small caps, market internals and new-high/new-low readings confirmed broad participation, volatility stayed near lows, and leadership expanded into metals, value, foreign equities, and multiple “modern family” groups. Offsetting this optimism are still-mixed volume patterns, lagging growth versus value, elevated leadership in defensive metals and gold alongside rising oil, and a few cross-asset signals (SPY/GLD, rates, crypto) that warrant monitoring for early warning signs if growth weakens.
Risk On
Neutral
Market posture: Stay risk-on, but not maxed out. Breadth, new highs, and global strength support staying invested, while mixed volume and metals leadership argue for discipline.
What to own now
What to be careful with
What to do this week
Risk controls

Every week you'll gain actionable insight with: