October 5, 2015
Trades & Tutorials
By Geoff Bysshe
October has been called the “bear market killer” and the month of market crashes.
Which is it?
The more I looked at the data the more interesting it became.
First, the reason I decided to look at the data is because last Friday I held a special training session for our Triple Play Trading members in which I specifically said the current market low is a huge opportunity. If you missed the emails to become a Triple Play member you can learn more about that here for a limited time.
Trading experience tells me that the inflection point created by the August “crash” creates a great trading opportunity regardless of which month we are in because of the size of its move. However, since October has a very mixed reputation, I wanted to figure out if I had any historical bias on my side.
The typical response to this question would be that in the last 50 years (my data begins in 1966), the S&P 500 cash index has had the following statistics for October:
Average return: 0.89%
Biggest up month: 16.3%
Biggest down month: -21.8%
Percentage of months with positive returns: 59%
This is not an adequate answer.
I believe you have to consider the context of market’s performance leading up to October. A simple explanation for this belief is that when markets get stretched they tend to correct.
If the historically accepted annual rate of return for stocks is roughly 8% (including dividends), I’ll consider “stretched” any move over 4% or 5% (not including dividends) in smaller periods such as a quarter or year to date.
So the real question is, what can we expect in October give the market is stretched to the downside?
As measured by the cash S&P 500, the market is down about 6.7% year to date, and it just finished a painful 3rd quarter (down 6.9%).
I decided to “get the facts” on what history would have us expect for this October.
But before we dig into the data there is a “trader’s reason” to suspect that October is subject to a calendar bias. October is the last earnings season of the year. This can quickly change the collective outlook for the New Year, and as a result, dramatically shift trading sentiment.
Additionally, it is the beginning of “the end of the year”. As a result, for those managing money or focused on year-to-date performance (and bonuses attached to this metric), the pressure to generate or protect returns on a year to date basis begins to come into focus in October.
So it’s no surprise that…
October has been called the “bear market killer” and the month of market crashes.
Which is it?
Maybe it’s both, and it depends on the context of October!
For example, I looked at the S&P 500 cash index from 1966 until now, and I found the best performing October was up 16.3% in 1974. That October was preceded by the worst year-to-date (YTD) performance leading up to October which was down 34.8%. Coincidence?
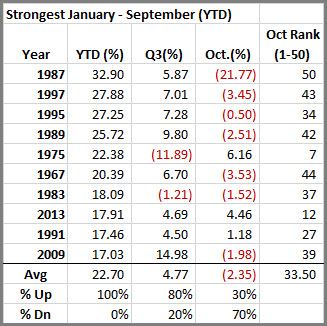
Now consider the fact the fact that the worst performing October was in 1987, down 21.8%. That October came in the year that had the best year-to-date performance in my 50 years of data, up 32.9%.
So do good years lead to bad October’s?
And does the performance of the 3rd quarter play a role?
In the data tables below you’ll find the percentage returns over the last 50 years for the S&P 500 (dividends excluded) for three time frames, January – September (YTD), July-September (Q3), and October. Additionally, I labeled each October with an “Oct. Rank” in which 1 represents the best and 50 represents the worst performing over the 50 years of data.
I also broke the data in deciles to see if the “top 10” as a measure of the “biggest moves” or historically “stretched” preceding October was significant.
Starting with YTD, you’ll see below that the top 10 strongest years led to a negative 2.3% return in October with 70% of the Octobers registering losses.
Interestingly, the best performing October in the group was in 1975 which had a very negative 3rd quarter.
You’ll also notice that the Oct. Rank column has 4 instances in which the rank is greater than 40. This means the top 10 best performing years have led to 4 Octobers that registered as the top 10 worst!
So if strong years tend to yield weak Octobers, what do weak years yield?
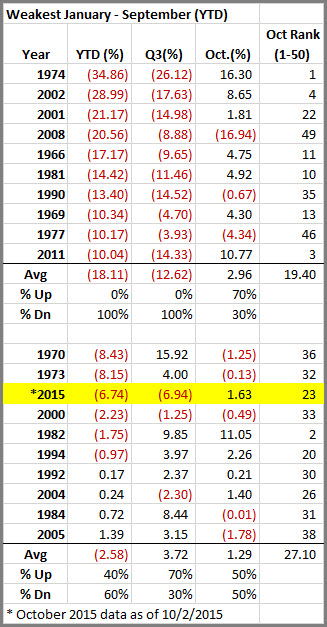
Below you’ll see the top 2 deciles of the weakest years leading up to October. By including the second decile you can see where 2015 falls in the data.
As it turns out, the weakest 10 years yielded a positive return of 2.9%. And 4 of the best ranked Octobers are in this group. That almost mirrors the strongest years!
Maybe October is a “bear killer” (more on this later).
As for 2015, you can see that it registers as the 13th weakest year-to-date performer, and in its decile the prospects for a strong October are not as good as the top decile, but as you’ll read below they may be better than this table suggests.
It seems that big year-to-date moves correlate with an opposite move in October, so the next question is how the performance of the 3rd quarter correlates with October.
Below you can see what happens after the weakest 2 deciles of 3rd quarter performance. This is a gold mine with the average return in October being a whopping 4.38%, and that includes 2008’s negative 16.9%.
In fact, 7 out of 10 months in this group returned 4.75% or better. Remarkably, 6 of the best 10, and 7 of the best 11 Octobers in the last 50 years are members of this “Top 10 worst Q3 performers” group.
But for the skeptics out there I’ll also concede that 2008 which is ranked 49th (second worst October), is also in this decile, so the saying, “don’t try to catch falling knife” still rings true.
Unfortunately, 2015 ranks as the 12th worst in terms of its third quarter performance, and again, its decile is not a blatantly bullish. However, take note that the bullish bias for October does hold true when you only consider 3rd quarters that were “stretched” (down at least 4%), and 2015 is firmly in that group with its -6.9% return.
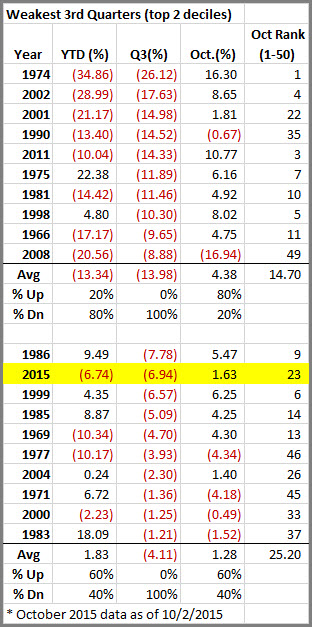
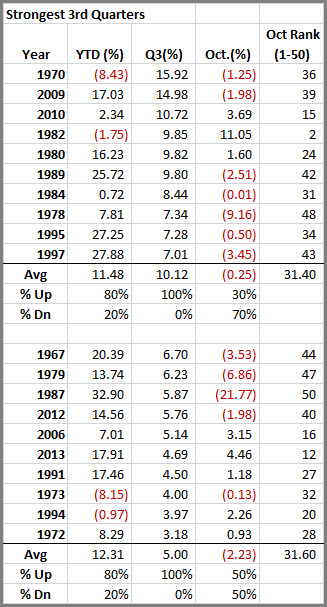
When the 3rd quarter is too good the party seems to sour in October.
Below I’ve included the top 2 deciles of third quarter performance because I found it interesting that negative correlation tended to hold up in the second decile when Q3 performance was over 5%.
Here’s where 2015 fits in…
As mentioned above, 2015 has experienced a weak 3rd quarter which has also created a weak year-to-date performance.
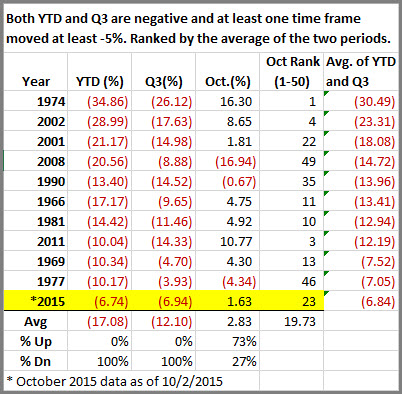
When we look at the last 50 years of data for situations where the context is negative year to date and a negative 3rd quarter, and the minimum move in either time frame was 5%, there are only 11 instances.
When you rank these years based on an average of the year-to-date and 3rd quarter returns, 2015 is the 11th most bearish.
October’s reaction to both time periods being negative has not been as bullish as the Weakest 3rd quarter statistics, but it does suggest a high probability that the current level of bearishness in the combined time frames points to a bounce in October.
4 of the top 10 or 5 of the top 11 best months of October occurred in this decile of data. And excluding this year’s 2 days of October performance, 70% of the Octobers ended with a gain.
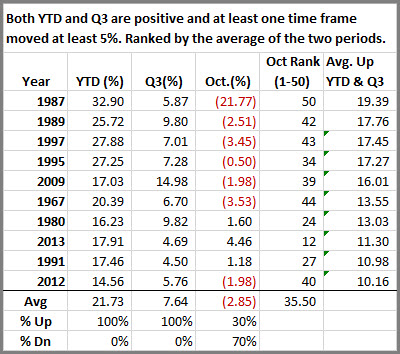
Finally, if we look at the opposite measure of momentum, a positive year to date and 3rd quarter with a minimum move of at least 5% in either time frame, we find the expected result – weakness follows in October in almost an equal proportion. 70% of the Octobers are down, and 5 of the 10 register as the top 10 worst performing Octobers (Oct. Rank <=40)!
In conclusion, when you consider the context of the current year-to-date and 3rd quarter performance of the market, there is a good probability that October could deliver returns of over 2.8% rather than the typically calculated average return of 0.89%
If such a strong bullish bias exists, then it’s a great time to find bullish swing trades with trading strategies like the Triple Play indicators.
Be the first to know when posts like this are released, follow us on Twitter @marketgauge


