May 8, 2016
Trades & Tutorials
By Geoff Bysshe

The reason such an ugly sounding statistic isn’t driving the market lower is because it’s not a surprise. It is, however, killing the market, and will perpetuate the current stock pickers market.
FactSet put out a nice research piece this week which provided a detailed look at earnings trends. The long term trends do not look promising but there are pockets of opportunities you can profit from. You can find the FactSet report, and a quick assessment of the opportunities below.
The chart below illustrates how earnings growth has stalled and done the same to the market.
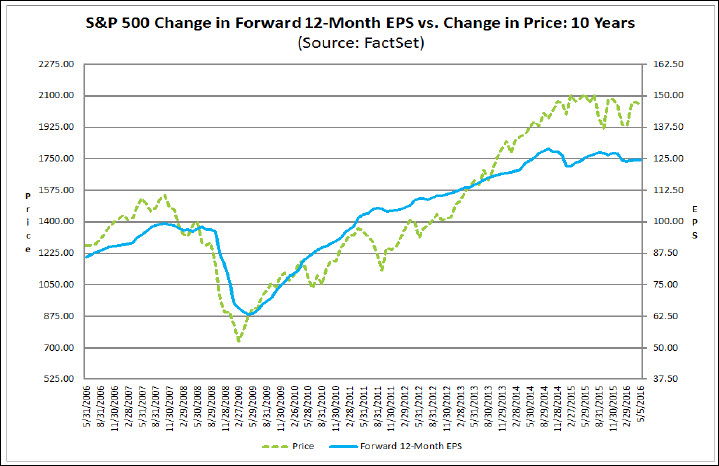
Source: FactSet Earnings Insight
Let’s take a look at where the bright spots are, and see how they relate to the price action of the market.
Below is a chart that illustrates which sectors of the market have been reporting earning above (green), in line (yellow), below estimates (red).
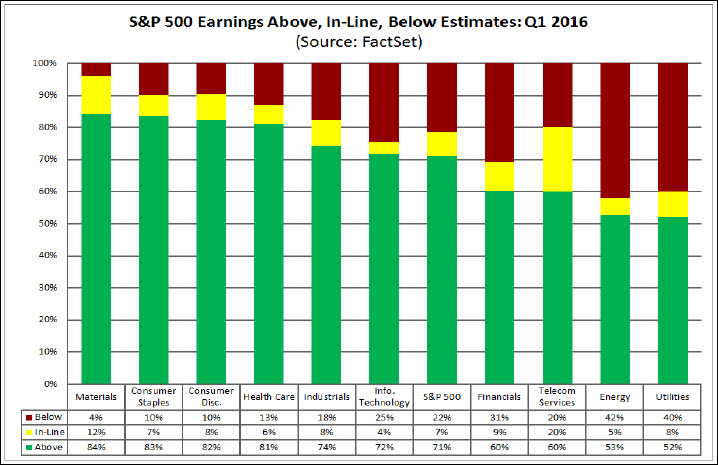
Source: FactSet Earnings Insight
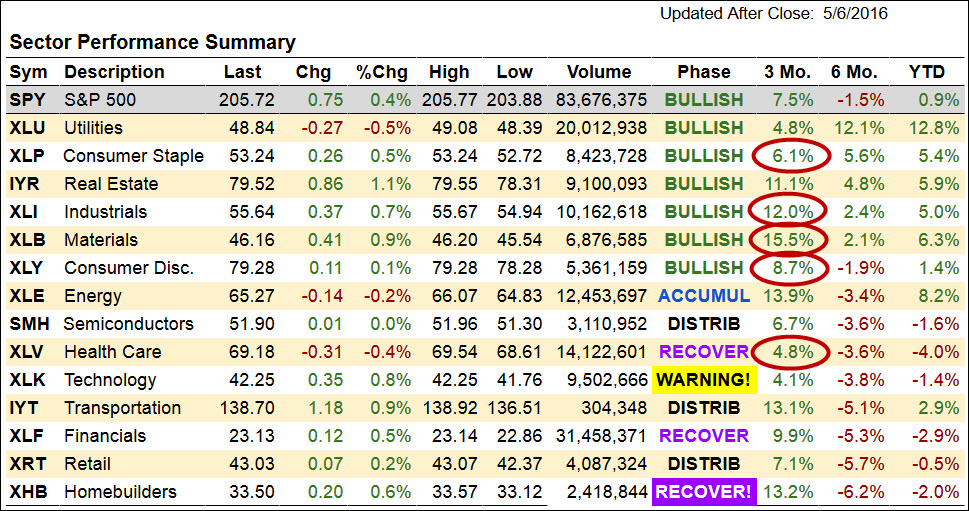
Not surprisingly you’ll see the ETFs that follow the top 5 sectors in the chart above also show up as some of the best performing over the last 3 month and 6 month periods in our MarketGauge Sector Summary page below, which is sorted by 6 month performance.
In my blog post earlier this week I illustrated how you can use positive earnings reports and market action to identify the stocks to focus on to find future strong trends. In a free training session on Thursday I demonstrated how you can pinpoint low risk, entry point for day trades and swing trades.
In this week’s Market Outlook video below I’ll look at whether or not Friday’s bounce off of the 50-day moving average is likely to be a big buying opportunity, or a temporary pause in in the current correction.
Plus, I’ll look at which sectors of the market look best positioned for a bounce or a drop.


