September 20, 2015
Trades & Tutorials
By Geoff Bysshe
I’m sure most traders are not happy on days when the Dow is down triple digits, until, but for the savvy trader…
When the down day ends, the fun begins!
After big down days like we saw on Friday (especially on option expiration Friday’s)…
I start making a shopping list of stocks to stalk because…
Big Down Days Reveal Big Bull Trades!
Warning: At the risk of over stating the obvious … Before I reveal this simple secret, it’s important to note that you can’t assume that every down day is followed by up days immediately.
Here’s how it begins.
Stocks that buck the trend on big down days should grab your attention like a “for sale” sign.
In this blog post I’ll show you ONE simple way to use days like last Friday to find big bullish trades.
Step 1. Look for stocks that closed up (or strong) on the big down day. This tells you that the stock was unusually strong on a very weak day.
Step 2. Within the list stocks that performed well, cull out those that are in a bullish position on the daily chart. A bullish condition can be as simple as looking at major support or resistance like the 50-day or 200-day moving average.
Step 3. When the market stabilizes you now have a good list of stocks that could explode higher and they are near major support and resistance that you can use to determine trigger points for trade entries and/or stops once you’ve entered the trade.
Before you get started, this is important…
Since the objective of this method for finding good stocks is to find the stocks that will outperform when the market stabilizes and turns around, you must make sure the stocks you find are not ones that move counter to down markets because they are viewed as ‘defensive’. Depending on the market cycle stocks in groups such as Gold, Utilities, Tobacco, big drug companies (not biotech) can be viewed as ‘defensive.
As you can see the “secret” to this is that the big down day in the market enables you to quickly identify stocks that have their own internal strength that enables them to trend on their own, even without the cooperation of the market.
And in case you like to short stocks, this same concept does work in reverse. Look for weak stocks in strong markets, and when the market gets weak they will likely break hard.
Some Examples
Below you’ll find a few examples of this tactic for identifying great stocks to trade. I’ve included one that’s worth trading now based on this tactic. (full disclosure – I hold a position in FB).
You’ll also see that I’m displaying the stocks on charts with proprietary indicators which may not be entirely fair because these indicators do what I’ve just told you to do. However they do it in a much easier, more sophisticated and continuous way.
I say that the indicators may be unfair because I’m using them to confirm that there is already an internal trend in the stock’s price momentum (the top indicator) and volume momentum (the bottom indicator). As a result, I’m not just looking at one day. I’m starting with the one day (the three steps above) to figure out which stocks to look at, then refining my list using 2 of the indicators in our Triple Play Trades system.
If you’d like to learn more about the Triple Play Trading strategies, and the indicators, we recently held a webinar and posted a replay here. (If the page says closed, leave your email address and we’ll notify you when we do it again)
In the first example below you can see how MYGN was almost unaffected by the massive plunge in the general market on August 24th. (you’ll have to look at your own chart of the market to see the plunge if you don’t recall it)
As soon as I saw MYGN’s strength on Aug 24th (and its Triple Play momentum was good with both price and volume indicators being bullish). The trade plan was to follow the breakout over the swing high and 200-day moving average which happened 3 days later.
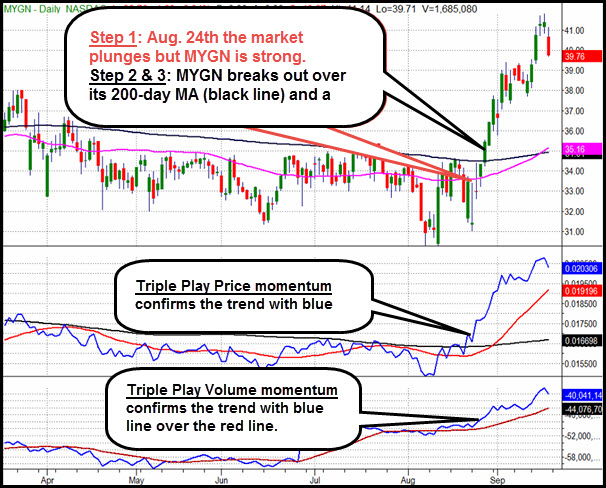
MYGN has dramatically out performed the market since its breakout, and still remains strong, although the most recent day’s action is in line with the market’s weakness so we’ll have to watch the pullback closely.
On the short side…
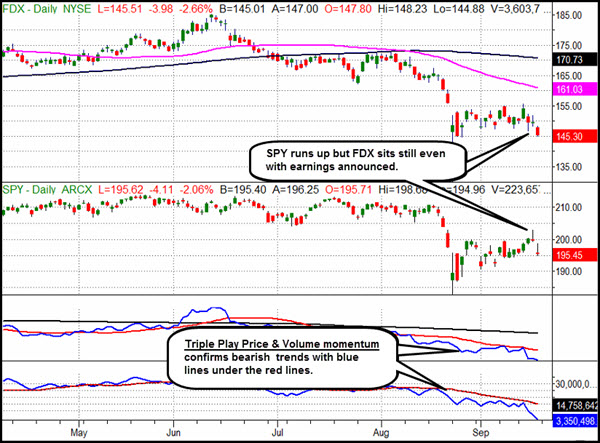
In the FDX chart below I’ve included the SPY so you can see how the SPY ran up Wednesday and Thursday and even broke out of its consolidation, but FDX just sat there. So it was no surprise that FDX would be weak with the market on Friday, but more importantly FDX looks like it will get hit even harder than the market if the market continues to sell off.
Of course the Triple Play indicators make this easy to see and show why FDX didn’t run up with the market to begin with as they are in a strong down trends, but even without them, the last few days could have tipped you off to trouble brewing in FDX.
Facebook!
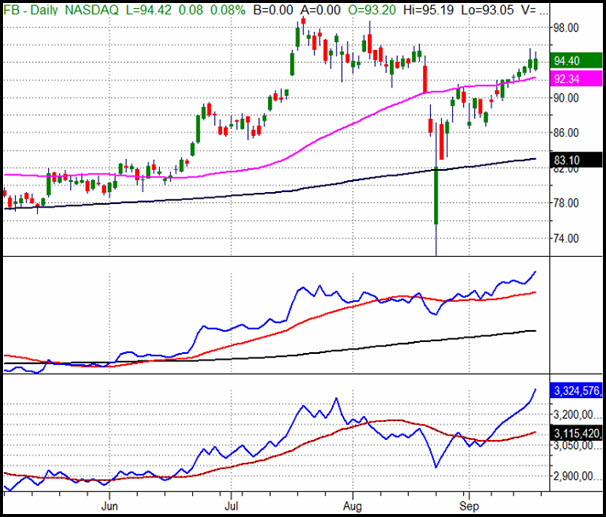
I’m highlighting FB because as you can see yesterday it met all the criteria I outlined above. While the market gapped lower it only did so marginally and it even held most of its intra-day rally from the lower open. Additionally it’s back over its 50-day moving average and holding over a swing breakout level at around $92. The SPY has accomplished neither of these objectives.
Both the 50-day and the $92 level should be support so long as the general market doesn’t plunge again. And if the market stabilizes, FB has a strong trend on the charts and in the indicators so it looks like it could go out to new highs.
Of course the Triple Play indicators do make this process for identifying and confirming good trades easier and more powerful, but an easy place to start is sorting you symbol list, or scanning for stock that close up or strong on big down days as I’ve described here.
For example I scanned the NASDAQ 100 for stocks that were strong on Friday and found quite a list of interesting stocks that are either in strong trends, or are trying to come back. They don’t all have great Triple Play trends and if some fall back down their Triple Play trends may go negative so be careful, but here’s a few more stocks to watch on the long side from that list: ADBE, ATVI, AMZN, CHKP, MYL
I hope this will put a positive light on big down days in the market for you going forward!
If you’d like to learn more about the Triple Play Trading strategies, and the indicators, we recently held a webinar and posted replay here. (If the page says closed, leave your email address and we’ll notify you when we do it again)


