September 7, 2015
Trades & Tutorials
By Geoff Bysshe
Here’s a little Labor Day surprise – 4 complimentary trade ideas from a “Top 10 Trades” list I’m creating for premium members.
Labor Day weekend represents the end of Wall Street’s summer so this is a great time to look for stocks set up for swing trades. Plus, the current market correction makes it an even more attractive time to find good stocks that have pulled back.
Later today I’ll release bonus video for new Triple Play members demonstrating how anyone can quickly and easily find trades by combining the Triple Play indicators with other good stock list like the IBD 50 List.
I’m using the IBD 50 list as my starting point gives me all the good stuff IBD provides which they would describe as…
“The IBD 50 is a computer generated list of the market’s leading growth stocks based on earnings sales, stock performance and other proprietary fundamental and technical indicators.”
Here’s The Premise of The Trade Setup
The general market is clearly under pressure now, but last week a few interesting bullish signs emerged indicating that as soon as this week we could see some nice bullish swing trades.
The first signs of a change in a market’s momentum occurs when the trend of a market’s 10-day simple moving average turns up. The first step to a 10-day average turning up is the price crossing over the average so that’s what the astute trader looks for, and right now you’ll find this happening in 4 important market sector ETFs.
Even though price closed below downwardly slowing 10-day moving averages in all the major indexes (SPY, QQQ, DIA and IWM), the following sector ETFs closed above their 10-day moving averages – SMH, IYT, XRT, and KRE. It’s also noteworthy that all but KRE have averages that are turning up.
Four sectors showing signs of turning up isn’t broad enough market momentum to be convinced that a new uptrend is in place, but it is a reason to look for stocks that are leading the market’s attempt to turn up. Here’s what I’m looking for to find such market leaders:
Currently, there are not many stocks that have had their Triple Play volume indicators turn bullish since the market’s plunge on August 24th. Therefore, a bullish volume reading is a uniquely powerful indicator when coupled with the other conditions in this trade set up.
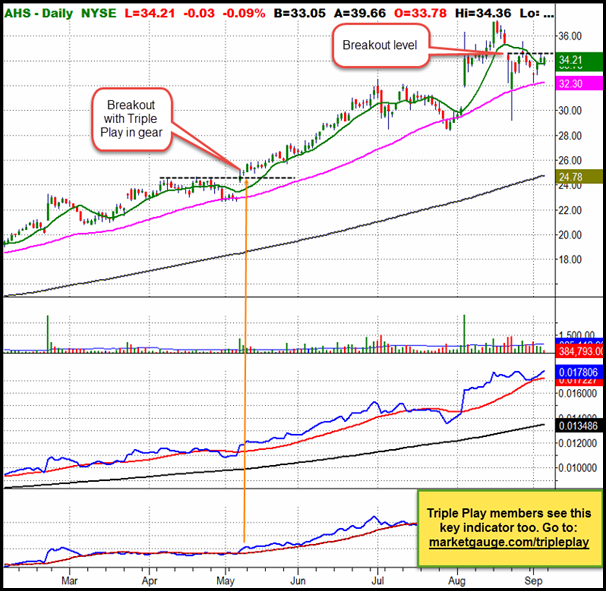
If you’re not familiar with the Triple Play Indicators, you’ll notice that I made some notes on the charts highlighting the conditions I’m looking for now – a price breakout or reversal at support, that occurs over the 10-day MA with both Triple Play indicators in a bullish mode.
You can also review a recent webinar replay about the Triple Play Indicators here (for a limited time)
Below you’ll find charts with additional trading notes on and above each chart. If you’d like to get the video I’m preparing with 10 Trade Setups simply become a Triple Play Trading member today.
The charts: The Simple Moving Averages (MA) on the charts are as follows:
Green = 10-Day MA
Magenta = 50-Day MA
Black = 200 Day MA
AHS - Despite Friday's selloff, AHS closed up and near the top of its range for the day. This suggests it is a strong stock. The trade is to buy a breakout over Thursday's high with a stop under Friday's low. The Triple Play volume indicator is not bullish yet, so make sure the breakout has good volume and if you're a Triple Play member make sure the volume indicator turns bullish within a day or two of any entry.
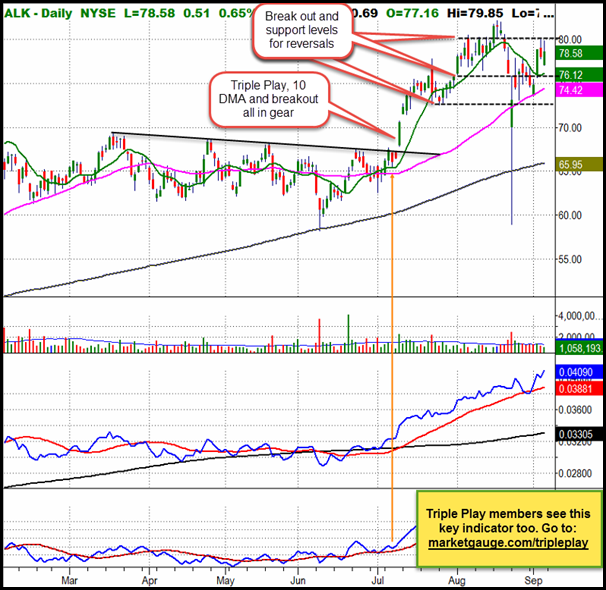
ALK: Like AHS above, ALK held up strong on Friday, and a breakout over 80 with a stop under the Friday low would be a good trade. Notice ALK is trading over its high of the 8/24 market sell off. That level also lines up with an important daily low and is just under the 10-day MA so it should be good support. This level, $75.60-75.80 would also be a good area to look for a daily reversal if the market gets weak before it heads higher.
Because the strong upward slope of the 50-day MA a daily reversal pattern near the lower support line (dashed) would be a good trade if the market gets weak and the Triple Play Price Indicator remains bullish.
Currently the Triple Play volume indicator is not bullish so be very careful with any trades and look for volume to confirm any trades quickly.
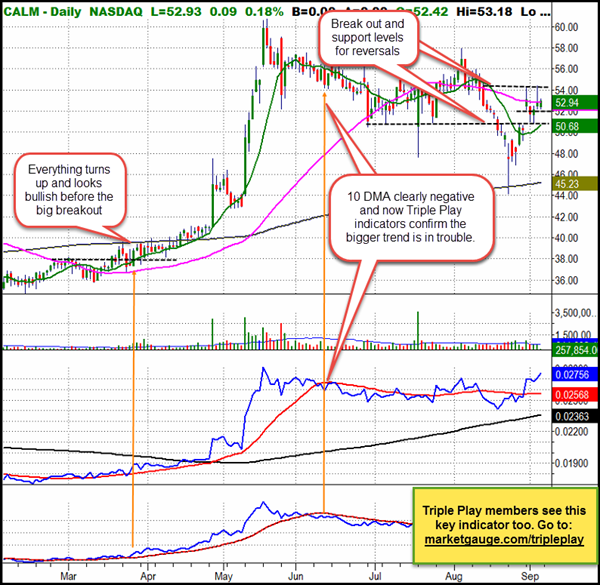
CALM: This is one of the very few stocks in the IBD 50 that has a bullish Triple Play volume reading!
However, it just turned bullish on Friday so a down day or two early this week might change that. If you're an aggressive trader a breakout over Friday's high with a stop under $52 could prove to be a very tight risk, high reward trade considering it could quickly move to $58. The 10-day MA at the 50.70 level lines up with good daily support so this would be a good place to look for a daily reversal in a weak market.
Additionally, I'd look for an opportunity to buy a breakout over last Thursday's high with a stop under the daily low prior to that breakout.
This relatively low volume stock (30-day average is about 250k) and it can have big range days. This is great when you're on the right side of the trade, but it also requires to you to be careful. Position sized for added volatility.
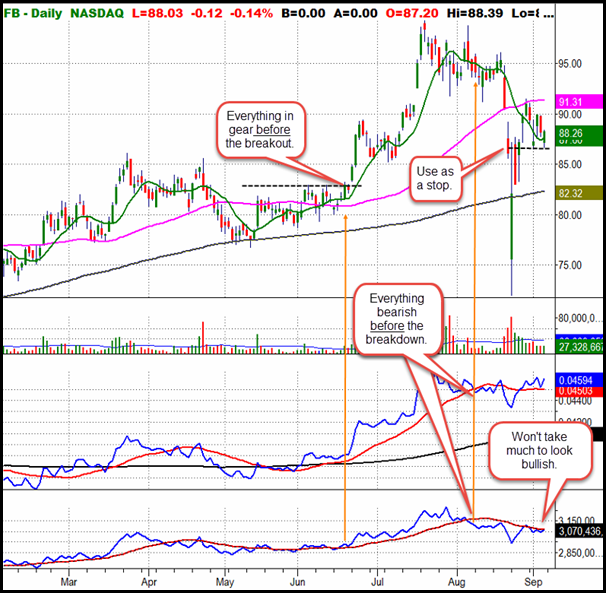
FB: Everybody likes to watch or trade FB, and with it influence on the QQQ it should be watched closely.
It also happens to be one of the healthiest looking big cap momentum stocks, so if the big momentum traders come back from the summer break in the mood to buy this may be a good one to be in.
Unfortunately there isn't a really clear line in the sand breakout level and as you can see the Triple Play volume is not bullish yet. In the short-term (this week) I'd only consider entering if it's above the 86.50 "use as stop" line I've labeled. However given its strong performance on Friday relative to the market, I'll be looking for and opening range reversal trade withing Friday's range on Tuesday.
Possible "breakout" levels include Friday's high, and over $90.
This will also have huge potential if the Triple Play turns bullish and it trades over the 50-day MA and recent swing high at the 91.50 level.
Final notes.
I realize that you may not have the Triple Play Indicators because the only place you can get them is here at MarketGauge. I recently presented them in a webinar so this post provides current examples of how they have performed in the past and how they are being used right now to make trade selection and management much easier. If you'd like to review that replay it may still be available here.
If you become a Triple Play member (or you're currently a member) you will be sent the Top 10 Trades video covering 10 trades I'm following into the Fall trading season in much the same way I've done above. This video will be released at 8:30 pm ET in the evening on September 8th to prepare you for the week ahead.
Pinpointing the right time to enter, and seeing when trades that look good may be vulnerable is easier with Triple Play insights, but all 4 stocks mentioned here offer trading opportunities even if you just apply the basic rules of following the trading action around the 10-day.
Best wishes for your trading!
Please send any questions or comments to [email protected] or comment below.


