August 3, 2025
Weekly Market Outlook
By Geoff Bysshe

It’s time to listen carefully to what the market is saying, get tactical, and prepare for better opportunities ahead.
Last week delivered a flood of market-moving events—earnings, economic data, fiscal policy moves, and political drama, but many were clouded or muted by controversy, contradiction, or doubt.
As a result, there’s a high probability of a new tone to market going forward, but to assess for “how long” and to what “magnitude”, we’ll have to look under the hood at each of the following potential market catalysts.
Any one of the above items could have provided a normal amount of news to serve as a significant catalyst, but each one was muted by controversy, contradiction, or doubt.
Use the links below to dive into the details of each and review the Big View bullets and watch Keith’s weekly market analysis video.
This would be a good week to make sure you don’t neglect to take a few minutes to watch Keith’s weekly video, which walks you through the most important trends and insights within Big View.
Our Big View product was conceived while Keith and I were managing money at Millennium Partners as a tool for our own use to keep us ‘honest’ and focused on the trends and internal health of the market, so FOMO or greed wouldn’t get the best of us.
30 years later, it’s still guiding us and thousands of members. We hope it’ helping you too.
You’ll find the video at the bottom of the Market Outlook commentary every week.
Earnings
In last week’s Market Outlook, we suggested that despite important news on inflation, the labor market, and an FOMC meeting, earnings would be the primary driver of market action.
While the employment report had some pretty shocking data, I’d still argue that earnings data was the primary market message.
According to FactSet…
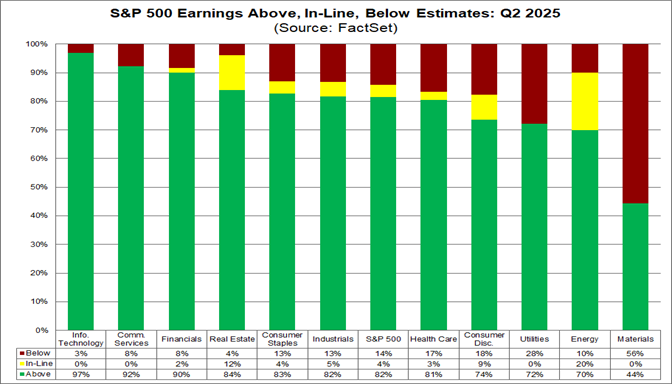
“Overall, 66% of the companies in the S&P 500 have reported actual results for Q2 2025 to date. Of these companies, 82% have reported actual EPS above estimates, which is above the 5-year average of 78% and above the 10-year average of 75%.... In terms of revenues, 79% of S&P 500 companies have reported actual revenues above estimates, which is above the 5-year average of 70% and above the 10-year average of 64%.”
The chart below provides a breakdown by sector.
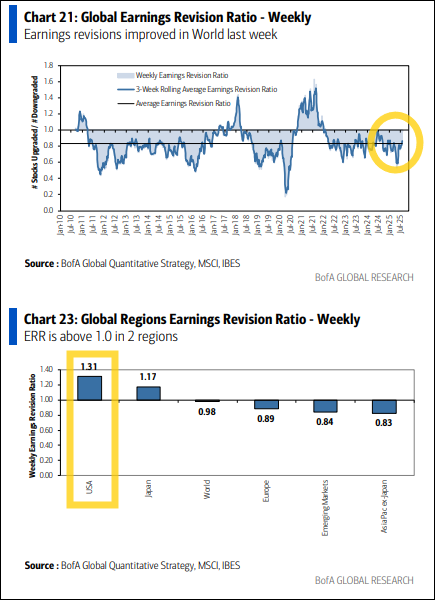
Not only are companies reporting well, but they are also revising UP.
Last week, Bank of America reported that the ratio of companies revising earnings up vs. down jumped to a 43-month high (.81) globally and a 24-month high (1.31) in the U.S., as shown in the chart below.
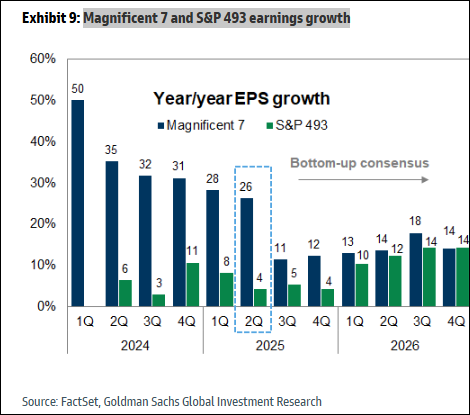
If we look at the longer-term trend in earnings and expectations in the chart below, we can see that the market has likely priced in expectations of declining growth rates from the MAG7 and the other 493 S&P 500 stocks into this quarter and next.
The expectation is then a steady rise in growth into 2026. Given this data the current rise in estimates is only consistent with generally improving expectations looking out over the next year. Good news for the longer-term prospects, but not a very significant short term catalyst.
Economic Growth
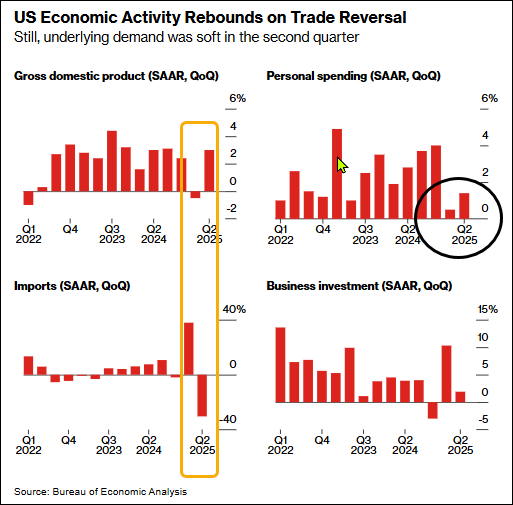
GDP came in stronger than expected (3% vs. 2.5%), but the data remained clouded by distortions stemming from tariff policies. As you can see by the yellow box in the chart below GDP data has been skewed by the volatility in imports.
One thing that is clear is the black circle around low personal spending. This is a clear softness in demand.
The Labor Market: Friday’s nonfarm payrolls report disappointed with just 73,000 jobs added versus expectations of 100,000. However, the bigger concern was the sharp downward revisions to the prior two months.
As you can see by the chart below this 2-month (2M) revision represents the largest on record back to 1979 with the exception of the pandemic.
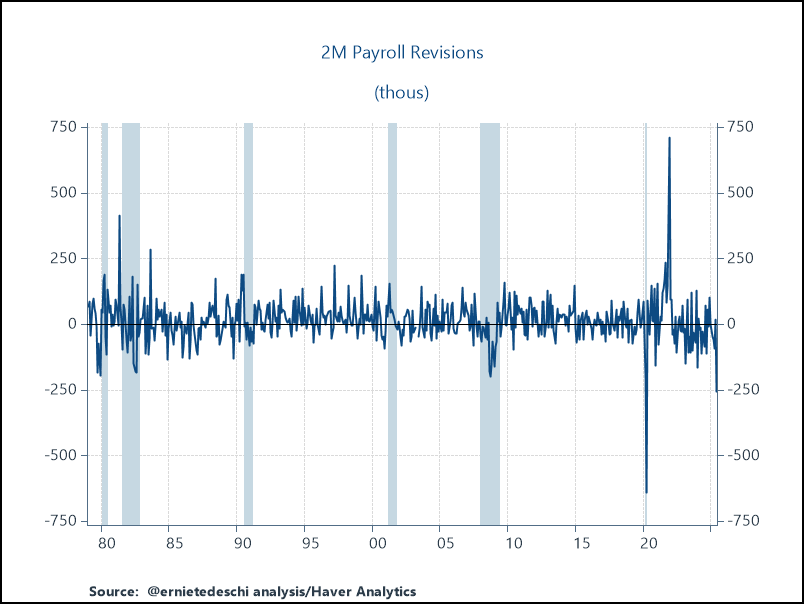
The resulting payroll trend now looks as follows:
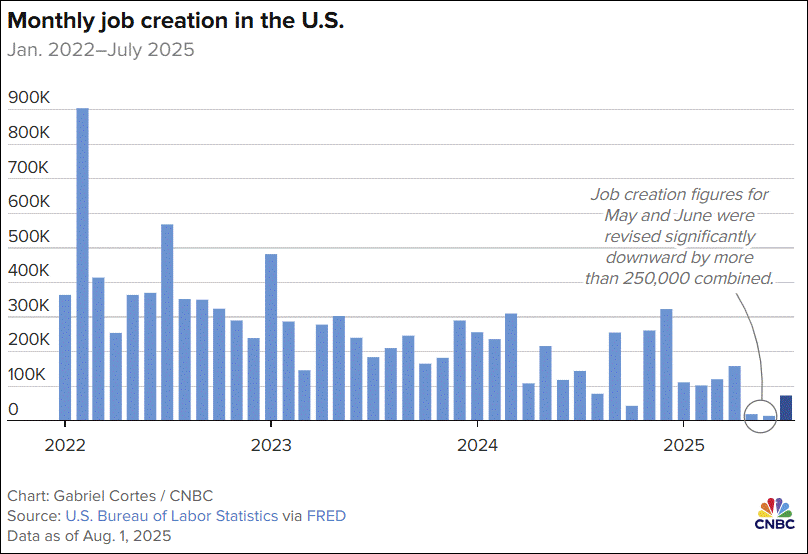
At the center of the debate between Chair Powell and advocates for cutting rates is the balance between the supply of jobs (payroll creation) and the demand for jobs (size of the labor force). The combination of these two factors results in the Unemployment rate, which Powell has said he’s focused on.
As you can see in the chart below, the change in the labor force since April (3-month change) in orange has dropped -0.5% which is one of the largest since the pandemic.
As a result, the lower job creation has had less of an impact on the inflation rate.
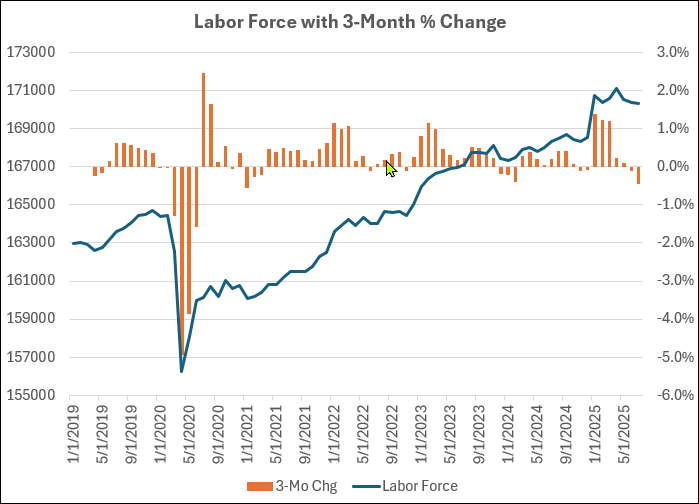
In short, deporting our labor force and discouraging immigration may have unintended consequences on the labor market and monetary policy.
Monetary Policy
The FOMC meeting included two dissenting votes for the first time since the 1990s. Still, Powell’s press conference stuck to a familiar script—signaling patience and data dependency due in part to the known and unknown impacts of tariff policies on inflation, and immigration policies changing the structure of the labor force.
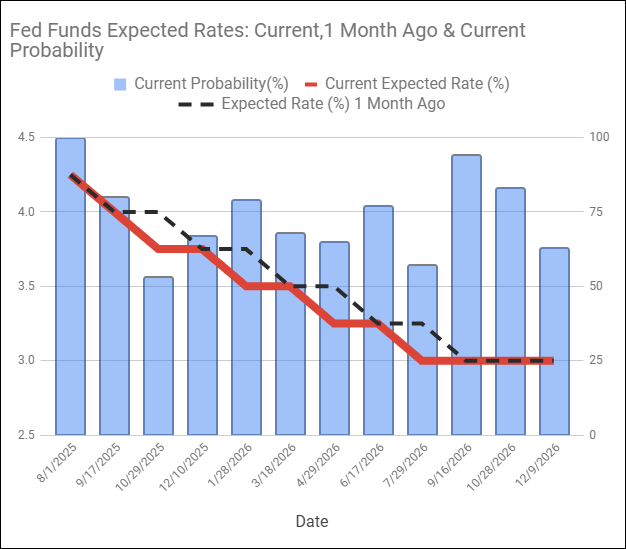
Chair Powell’s message that he wants more persuasive data on inflation and the unemployment rate, but the market expectations by the end of the week pointed to lower rates ahead, with or without him.
As you can see from the blue column in the chart below, the market now has the odds that he’ll cut in September at over 75%, and equally high odds that we’ll see 3 cuts (3.5% Fed Funds) by the January meeting.
The shift down in the red line from the black dashed line represents the change in the expected rates over the next year.
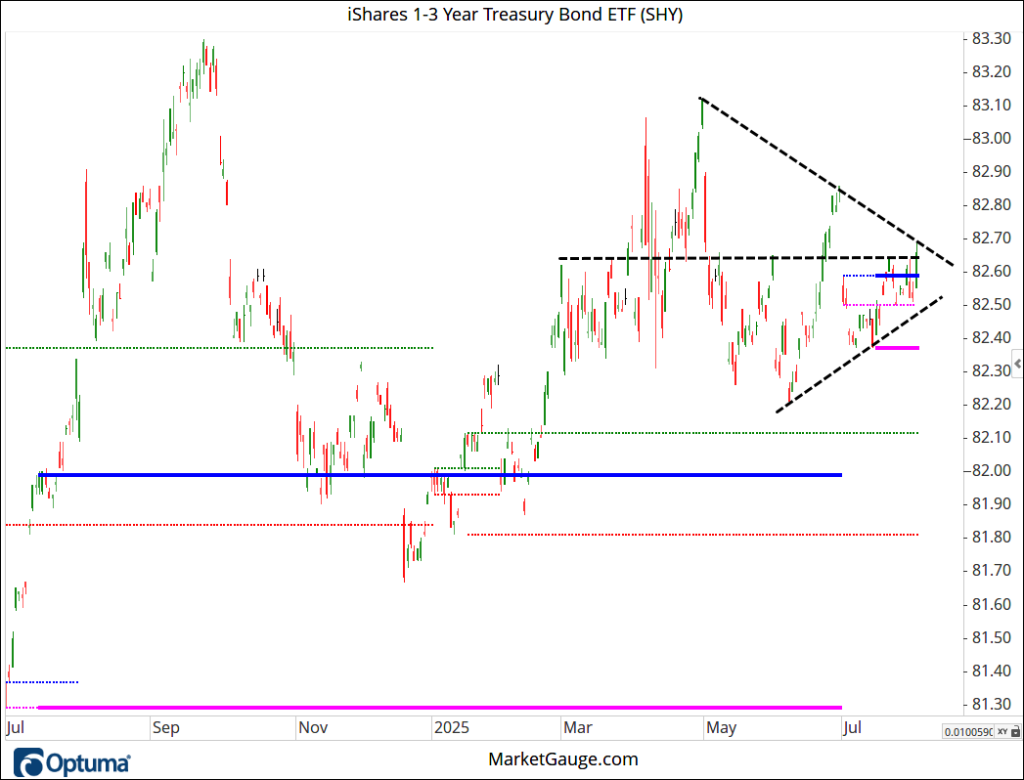
Looking at the ETF that tracks the 1-3 year bonds below, you will see lines showing the compression and last week’s move above the July high and a big horizontal resistance level. Higher bond prices mean lower rates.
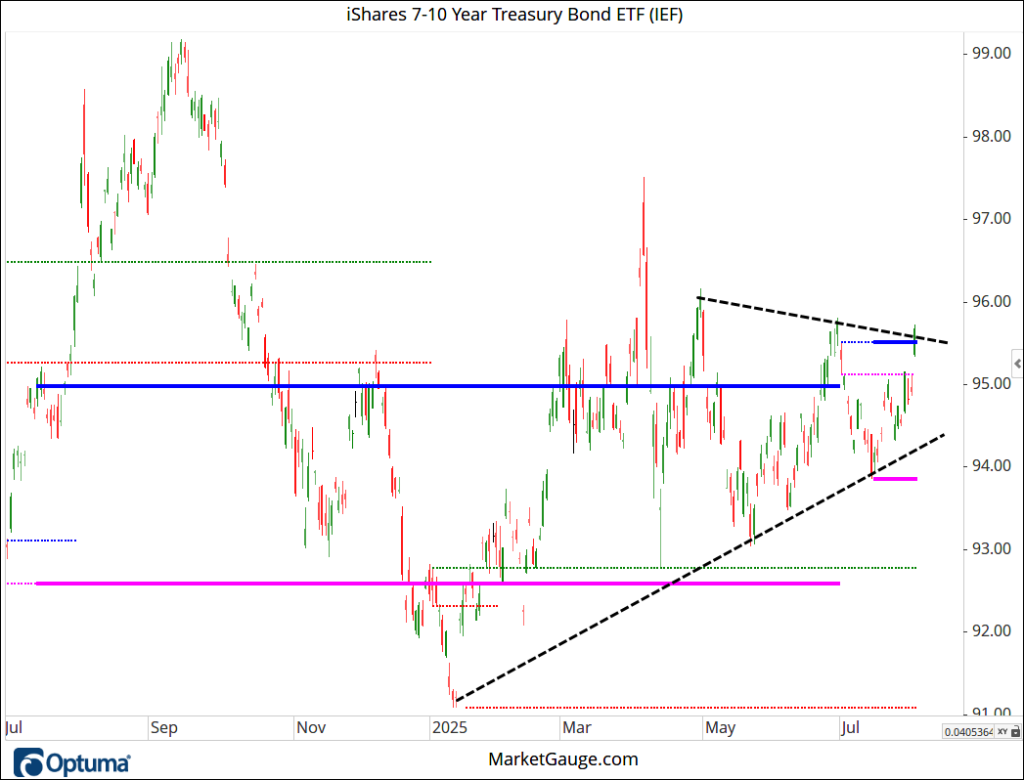
The 7-10 year bonds ETF also looks like there is potential for a bullish breakout of a compression pattern and a key horizontal level (below).
As we move out to the riskiest part of the yield curve, the 20+ year bonds ETF, the breakout of the compression is beginning, but the trend has not yet turned higher relative to the July high (blue line)
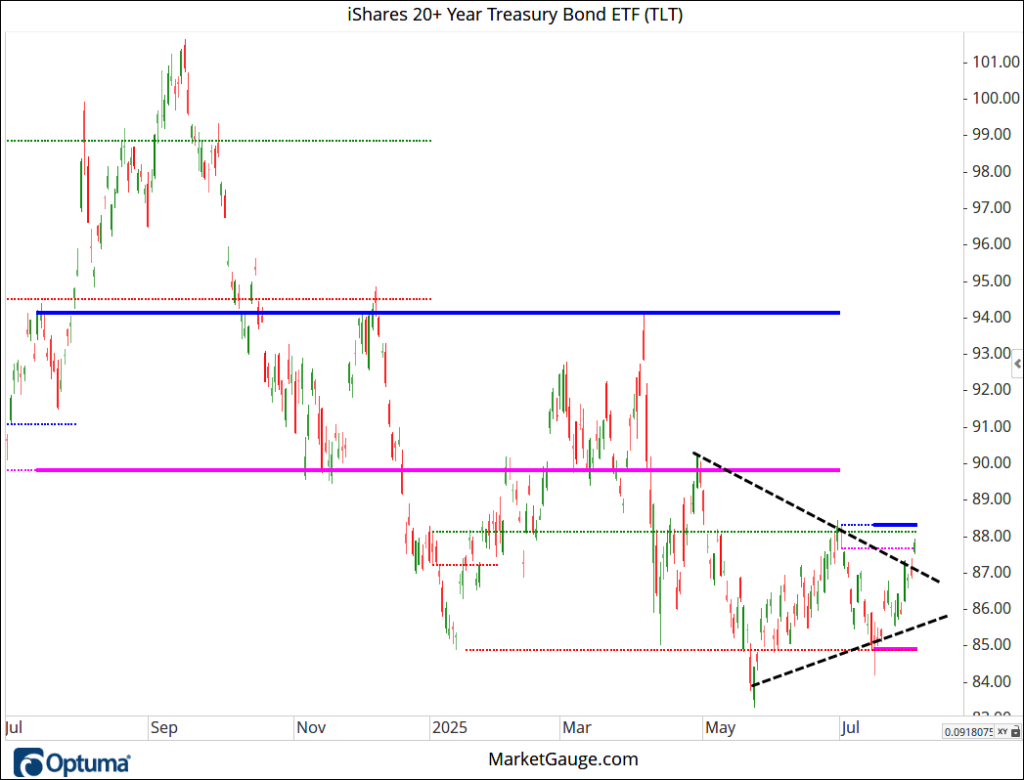
The summary of the rate picture is one that looks like the short end expects economic weakness, but the long end fears something – inflation and deficits?
Summary
There are reasons in the GDP data and the labor market data to be concerned about a slowing of the economy. The interest rate market suggests it sees this too.
The Fed sees the weakness but also feels the need to consider the inflationary risks of lowering rates, given all the uncertainty surrounding the tariffs and the labor force.
In the not-too-distant past, we would have been talking about the market liking fiscal gridlock. Under the current administration, the gridlock certainly isn’t on the fiscal side, and all the moving parts are creating a level of uncertainty that the market has had to adapt to.
There is, however, gridlock between the administration and the Fed, and I think the market is just fine with it.
The market sold into Google’s good earnings report last week, and then did the same with MSFT and META before the weak labor report. AMZN didn’t deliver surprisingly good numbers, and it got punished.
A healthy market needs good corrections, and these often start just like last week. Profit taking makes sense when investors doubt the good news can continue at the same pace.
Last week, the market sold into good earnings news, and at the same time, there was elevated doubt about what the economic data implied for economic growth, and there was a lack of new buyers to continue to support higher prices despite better than expected earnings.
This is an environment where quant models and savvy active investors can thrive by managing downside risk. Make sure you take a few minutes to watch Keith’s weekly video (below), which walks you through the most important trends and technical insights that are driving this correction.
What's Your Game Plan?
There are several ways to protect your portfolio and simultaneously build your wealth despite the market, political, and economic uncertainties that flood the media's attention.
The markets have a way of revealing the collective consciousness of the market-moving investors. With a focus on the market's message, algorithms, and educated active investors, gain an edge in achieving higher returns with lower risk and drawdowns.
Several of MarketGauge's algorithmic models and systems leverage several market edges to cut through uncertainty by identifying the sectors and companies that demonstrate an ability to outperform.
Additional algorithmic systems use intermarket market relationships and market internals data to measure the level of risk-on/off behavior of the collective market consciousness. These systems provide an edge in determining optimal times to be bullish, cautious, and bearish without relying on the news.
MarketGauge also provides active individuals with the opportunity to learn how to identify market edges and then trade with simple systems that turn edges into profits, protection, and confidence in your ability to navigate any market, political, or economic uncertainty.
If you're a new or veteran active investor and would like to improve your returns and risk management through watching or participating in live trading, 24/7 availability to online education, proprietary systems, indicators, and/or done-for-you trading ideas...
Schedule a free, no obligation, conversation about how MarketGauge has helped others like you achieve better results from the market. Contact Rob at http://www.MarketGauge.com/call
If you'd like to discuss ways to have your assets managed for you, or if you're a professional asset manager, RIA, etc. who would like better, more tactical systems for asset management...
Contact Ben at [email protected] for a free demonstration of our professional services.
Have a great weekend,
Geoff
 |
 Every week we review the big picture of the market's technical condition as seen through the lens of our Big View data charts. Every week we review the big picture of the market's technical condition as seen through the lens of our Big View data charts.
The bullets provide a quick summary organized by conditions we see as being risk-on, risk-off, or neutral. The video analysis dives deeper. |
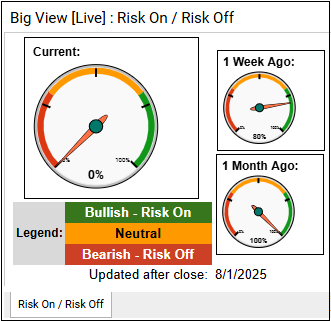
Summary: Markets flipped decisively to risk-off this week, with major indexes breaking down from all-time highs with a confirmed bearish engulfing pattern, volume and internals turning negative, and nearly all sectors—including key economic bellwethers like transports and retail moving into a distribution phase.
Risk On
Neutral
Risk Off

Every week you'll gain actionable insight with:


