September 4, 2022
Weekly Market Outlook
By Keith Schneider
 All of us at MarketGauge and MarketGauge Asset Management (MGAM) want to wish you and your family an enjoyable and relaxing Labor Day Holiday. It is because of what you do, or have done and the service Americans provide that keeps us the most prosperous and productive society in the World, making great advances daily all while maintaining our freedom and liberties. Thank you as well for being a loyal follower and customer of our services.
We are facing a great number of headwinds. Someone we follow had a commentary this morning that said “wake me up after September.” I will cover some of the upcoming challenges we may be facing. However, I always think it best to listen to what Mish has to say. She knows far more then me about the market phases, economic backdrop and where to emphasize your attention. Please review her great appearances recently with Neil Cavuto and on Bloomberg TV. We have provided the links below.
 Will the Selloff Based on the Hawkish Fed Continue?
 How Bitcoin and NASDAQ Trade in Tandem
 Now that Jackson Hole is Done, What's Next?
Click here for more media clips from Mish
I, Donn, am fortunate that my partners allow me to contribute some of my own personal thoughts and experiences. I had one this past week.
I was invited to a lunch meeting on Thursday that was at a yacht club right outside downtown Cleveland near the private airport that will be used for the Annual Air Show held over the holiday weekend.
To my surprise and delight, the Blue Angels were practicing their maneuvers during lunch time. If you have not seen them perform, it is a spectacular sight to see. The Blue Angels are part of the US Navy. They have been performing at this annual show since 1964.
These accomplished Naval and Marine men and women perform from March to November each year. The estimate is that 11 million direct spectators view their acrobatics. During the show (and the practice) they fly up to 700 mph, but won’t go over that speed to avoid creating a sonic boom. When flying together at those speeds, the closest they will fly to another plane is 18 inches. Since 2000 they have been flying Boeing F/A 18 Super Hornet aircraft.
What they do is very dangerous, and they are the best of the best. It is important for the military to be able to demonstrate how talented and well prepared our military is. The Blue Angels are used as a PR campaign. This type of US military aircraft demonstrations began in 1946.
While watching them directly above me (the sound was deafening) they were so close we could smell the jet fuel. As we witnessed the loops, dives, climbs and sideway movements, it reminded me of the stock and bond market movements recently. Upside down.

To have a positive outcome in their flight and planned precision aerobatics, the Blue Angel need to use the headwinds for maneuverability.
The stock and bond markets are no different. (MarketGauge still has several investment strategies that are positive year-to-date against the current headwinds) . Talk to Rob Quinn our Product Specialist to get more information on all of the investment strategies MarketGauge offers along with the 6 that are producing positive returns year-to-date.
What Happened To The Summer Rally?
We had been enjoying a powerful and long overdue rally in the stock and bond markets from mid-July to August 22. As Mish conveyed in her recent national TV appearances (watch the replay links offered above), we had recaptured about 50% of the decline from January through the June lows. The markets hit resistance at the 200-day moving average and had trouble sustaining the move up. Then the Hawkish Fed Governors got together in Wyoming. Below we show just how difficult a market it has been through late August. Only two sectors, Energy and Utilities have positive year-to-date and August returns (through August 30):

In fact, this is 4th worst first 169 trading days we have ever experienced. See chart below:

Clearly, the markets are caught in the late summer doldrums. Ever since Jerome Powell’s brief, but hawkish commentary at breakfast in Jackson Hole last Friday, the markets have been on a severe downward trajectory.
Continued headwinds are testing investors resolve and may continue to look very much like a F/A 18 Super Hornet performing at the Air Show. What might we expect next?
September Can Be A Volatile Month. Caution Advised.
September is typically a bumpy ride. Historically, September is the worst month to invest in the stock market.
Add in negative investor sentiment, rising interest rates, a non-accommodative Federal Reserve, mid-term elections and elevated prices of food, energy and rents, and you have a recipe for a potentially turbulent upcoming month or two. Take a look at the following charts:


There are some bright spots that typically occur during September, but by and large historically it has not been a kind month to long-only investors. The NASDAQ is usually the worst performer.

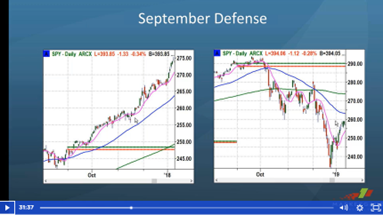
If you’re an active trader, you may want to watch Geoff’s webinar from last week which describes a trading tactic for avoiding any major decline in September without missing the upside (if the market rallies). Click here for the replay (this weekend only). This concept is covered at about minute 31 (shown below).
Here are our 5 Tips for helping you navigate the volatility.
-
Talk to Rob Quinn our Product Specialist to get more information on any of the services above.
Here are some additional insights from Big View:
Risk-Off
Neutral

Every week you'll gain actionable insight with:


