August 24, 2025
Weekly Market Outlook
By Geoff Bysshe

Looking out to the end of 2025…
Would you rather own Home Builders (XHB) or Semiconductors (SMH)?
It may seem like a strange question to ask and an easy one to answer, but don’t answer too quickly.
The best market indicator for the next several months may not be the market expectations of Fed Funds rates, but rather the market’s expectations for the housing sector.
On Friday, stocks and bonds soared, and interest rates sank as Fed chair Powell described his expectations that inflation will likely rise and the labor market will likely continue to weaken as it appears to be in “a curious kind of balance…”
That sounds like a lot of “known unknowns.”
To which he concluded that this “unusual” situation could prompt the Fed to support economic growth by reducing rates.
You may recall that the market’s reaction to the last Fed rate cut on December 18th, 2024, was an immediate and significant drop in stock prices and a rise in long-term rates. And both bearish trends continued until the middle of January.
Can You Trust Friday’s Market Reaction?
Friday’s market reaction to Mr. Powell’s speech is only the initial reaction, which doesn’t always prove to be durable. This week we’ll see what the market thinks after having had the weekend to sleep on it.
In preparation for the next reaction, there’s a lot to unpack in this Market Outlook’s weekly Big View Bullets and Actionable Trading Insights, Keith’s video analysis, and commentary exploring an indicator to help avoid getting head-faked by counterintuitive market reactions to Fed policy moves.
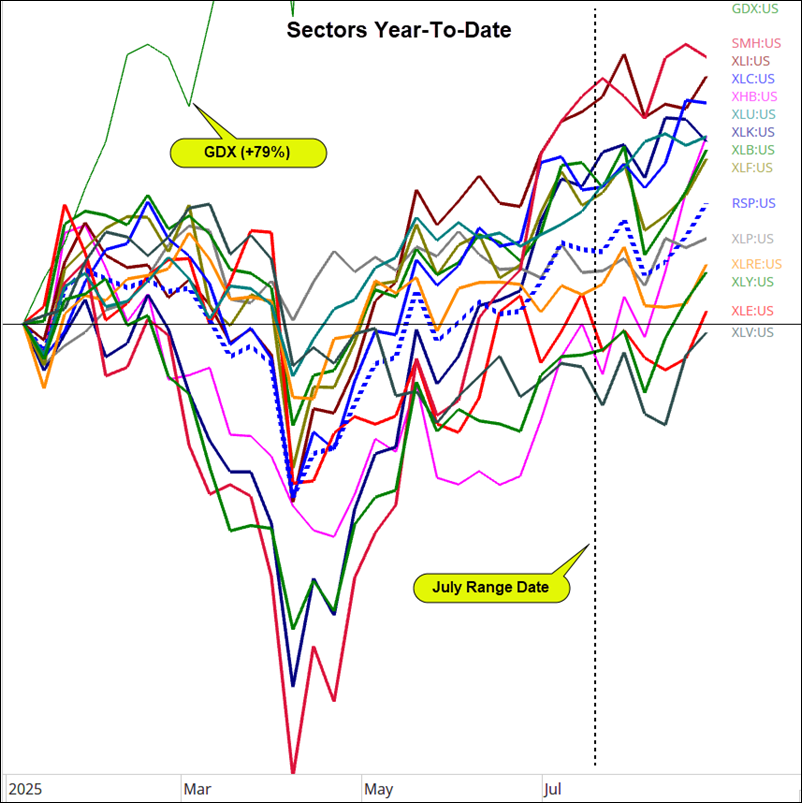
As you can see by the chart below, the Semiconductors (SMH) continue to lead the bull market higher, but there is also some important market rotation happening underneath that leadership:
Is The Broad Market Finally Breaking Out
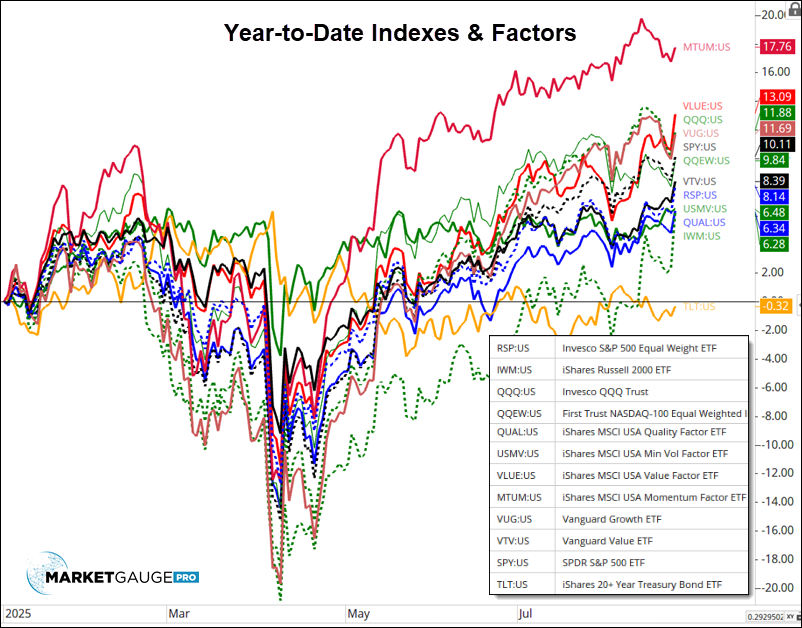
The chart below shows the performance of several indexes and market factors since the beginning of the year.
As you might expect, the momentum factor has soared to new YTD highs since the April correction. Other measures, such as Value (VTV or VLUE) and equal-weighted indexes such as RSP and QQEW, are just breaching their January highs.
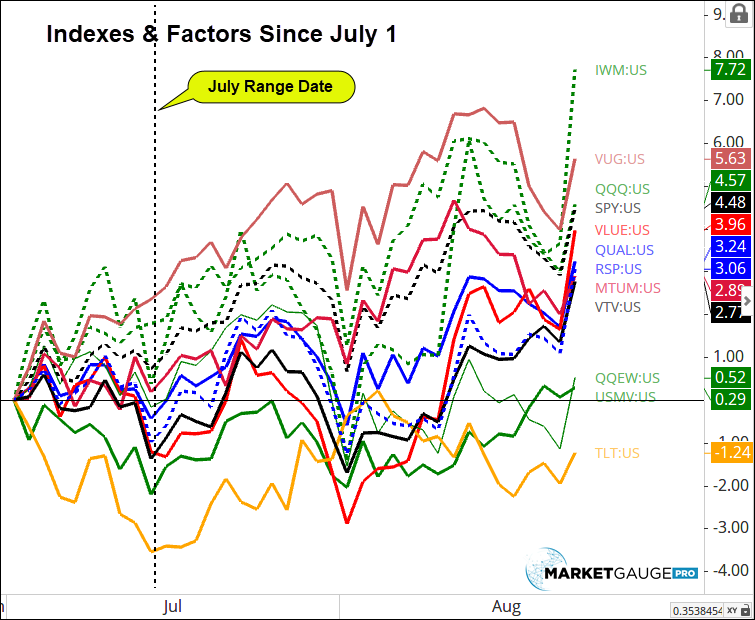
If we look at the same list of instruments since July 1, you can see that MTUM hasn’t been leading.
Healthy rotation? I hope so.
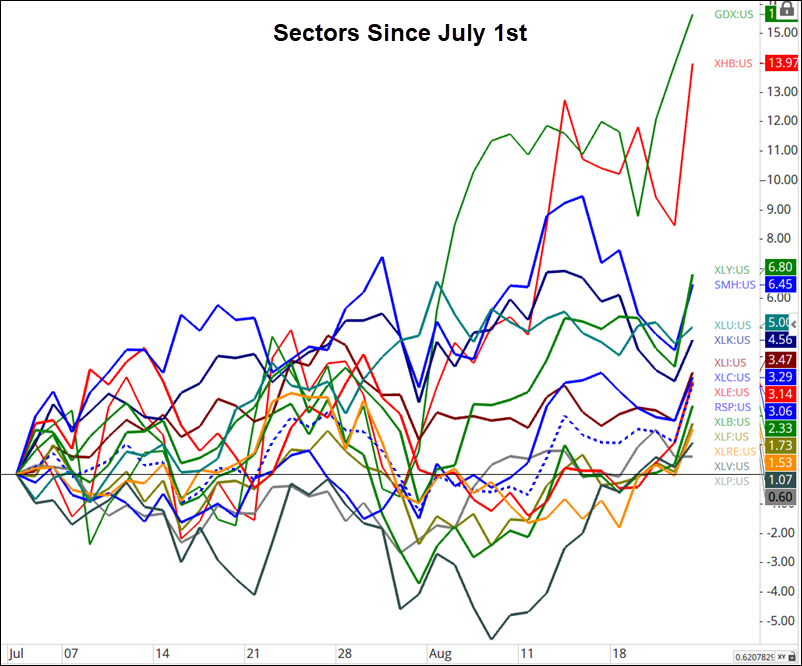
Getting more specific, a look at the moves within sectors since July 1, (shown below), you can see that Home Builders have been the strongest sector other than Gold Miners.
The move in the home builders is significant for a few reasons.
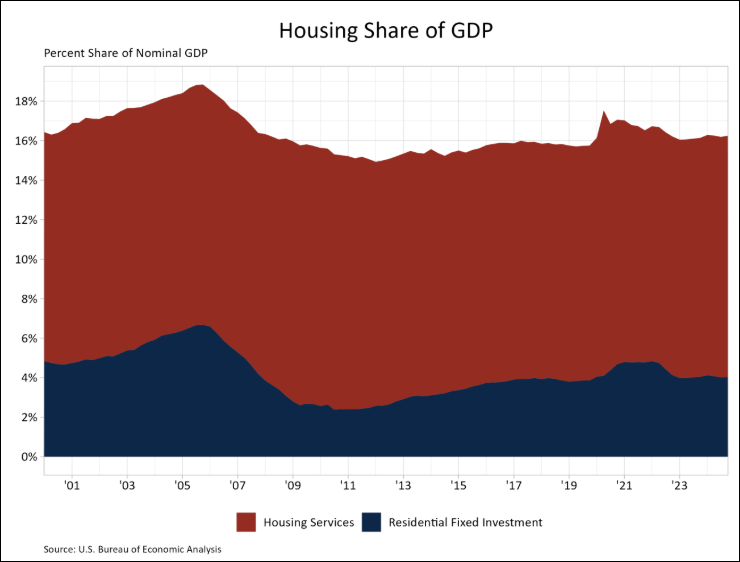
Of course, housing demand is linked to the strength of the labor market, so we hope that the Fed’s “curious balance” in the labor market works out in favor of continued economic growth and a strengthening of the housing market.
There are other factors that could support housing and GDP.
Earning Season Delivers
As we’ve been saying since the start of the second half (July), the main driver of equity prices through August and into the Fall was likely to be corporate earnings.
As earnings season comes to a close with 92% of S&P 500 companies having reported, Goldman Sachs' chief equity strategist wrote, “The quarter has been marked by one of the greatest frequencies of earnings beats on record.”
This is illustrated by the chart below:
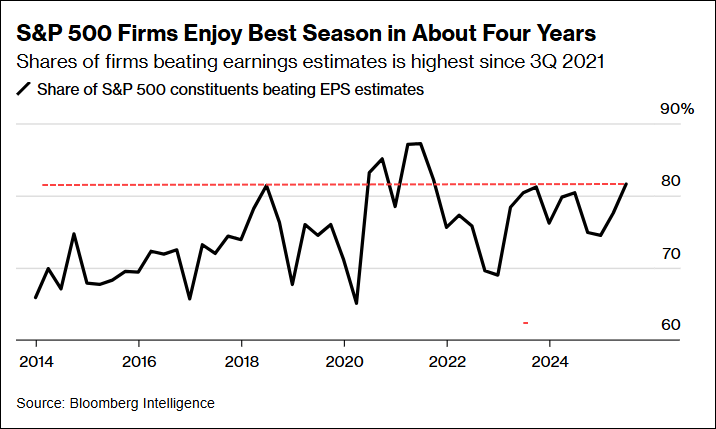
The red line demonstrates that if you look past the pandemic, this level of beats is extraordinary.
To be clear, analysts reduced their estimates going into the quarter due to tariff concerns, but tariff fears with respect to earnings and margin compression have not lived up to expectations.
Additionally, as you can see from the chart below, guidance for the current fiscal year improved over the quarter.
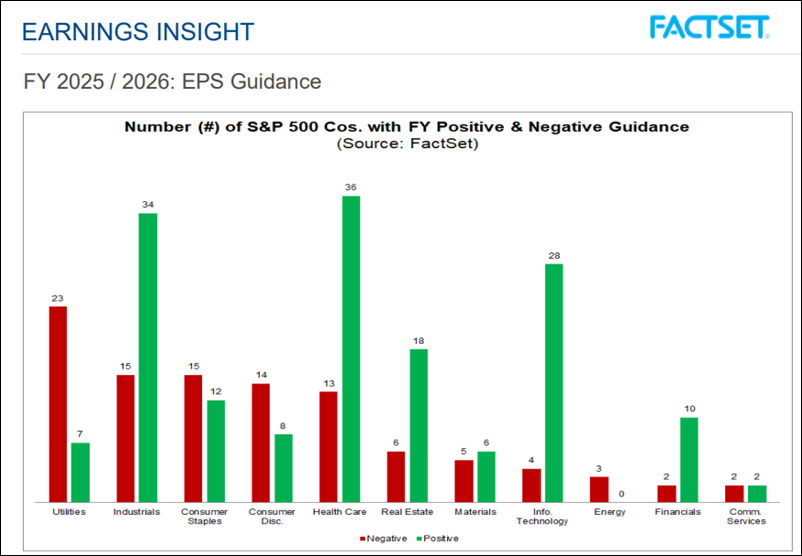
While the aggregate picture of earnings looks strong, it is worth noting that the guidance in consumer discretionary and staples leaned negative, and these areas are much more exposed to tariffs. On the other hand, healthcare, info tech, real estate, and financials all reported bullish guidance numbers, and they’re less exposed to tariffs.
What Could Go Wrong?
If earnings are good, the Fed is likely to cut in September, and the market is signaling that even the housing market may begin to recover, what will hold down this stock market?
There’s never a shortage of bearish arguments, but we won’t cover all here right now. It’s not the bearish stories that concern me as much as the potential for the expectations of the bulls getting deflated.
In other words, warning signs that the market will sell off will likely come with bearish price action in the face of either good news or missed consensus reports. We’ll cover this in more detail next week.
In short, watch the price action!
Since July began, we’ve advocated watching the July Calendar Range closely. If you have familiar with it or would like a very quick refresher, I gave one in an interview with the MidDay Bell podcast last week, you can see it here:

If you have access to Big View premium, you can also get the table you see below in the Calendar Ranges page of the Seasonality area here.
The screenshot below shows that currently, the market indexes are all above their July range high, and only a few sectors are inside their range.

If we see more sectors fall into their 6-month range (show blank in the table), or if we see sectors turn red in the Six Month column, then the market is beginning to roll over.
Watch Home Builders (XHB)
The shortcut and potentially the quick alert that the Fed’s new, more accommodative tone isn’t going to pan out to be as bullish as Friday’s price action suggests may show up in the act of the XHB first.
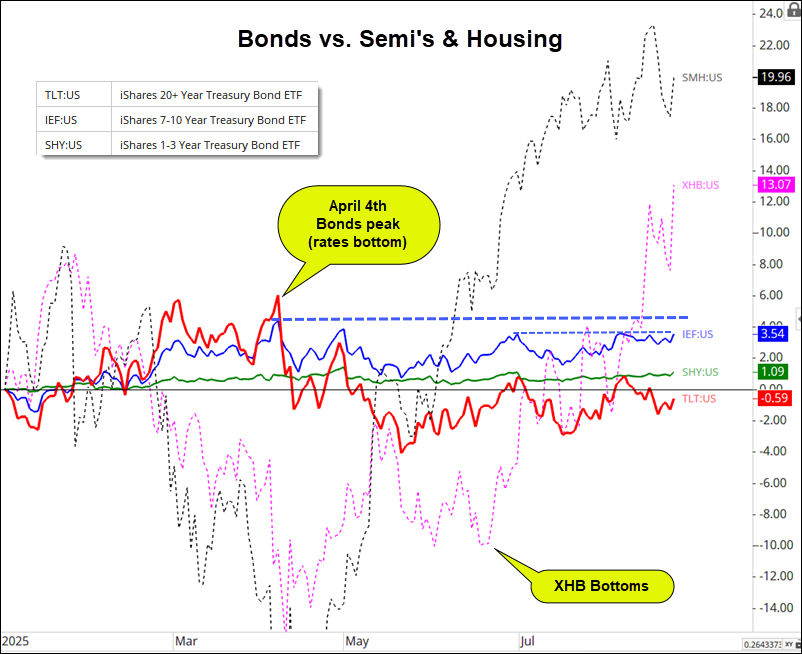
As you can see in the chart below with the three interest rate ETFs, the SMH and XHB have followed a similar pattern coming off their April lows. They both corrected in mid-May and mid-June and accelerated higher in July and August.
What may not be as obvious is that XHB has rallied about 23% since the time marked as “XHB bottomed,” and SMH has about half that.
Rotation? Maybe.
More important than just looking at XHB as a rotation trade, it could be an indicator of how satisfied the market is with the balance between interest rates, inflation, and growth. This is the same balance the Fed is trying to navigate.
XHB benefits from a better growth outlook and lower interest rates, and both of those can be viewed as inflationary which has a negative effect on interest rates.
As a result, if XHB continues to rally in the current environment, it should be a good indication that the conditions for a broader market rally are in place.
Big tech and semiconductors could be less sensitive to interest rates, and they could consolidate if the market broadens out.
For example, on Friday SPY, IWM, XHB, XLF and XRT hit new YTD highs, but SMH and the other tech ETFs did not. If the SMH and other areas of big tech start to pull back, it will look and feel like the market is bearish.
However, if the economically sensitive ETFs hold up, then the market correction will likely be shallow.
If the Fed cuts and rates respond with the 10-year represented by the IEF ETF breaking out above the blue dashed lines, the rate-sensitive ETFs should respond positively. If housing, XHB, leads, it will be very bullish with or without tech leadership.
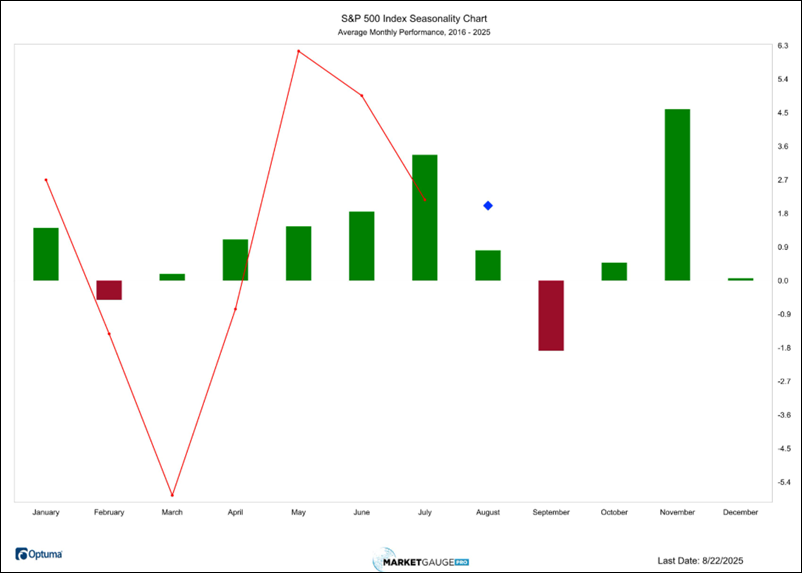
Remember September
Three of the last four Septembers have been quite bearish. Over the last 10 years, September has been the worst-performing month, as you can see by the chart below.
If you’d like to see the seasonality chart for other indexes and sectors, you can find them in the Seasonality area of Big View.
Looking Forward
With an eye on the July Calendar Ranges in the stocks, sectors, and bond ETFs, and a keen eye on the Home Builder’s response to the Fed and the key economic reports, you should be in good shape to confidently stay with the bull market until you see it rolling over.
If you’d like help doing this as a discretionary trader by joining our live trading room, or if you’d like algorithmic trading strategies to determine all your trade entries and exits for you, email us for a no-obligation demo and strategy call.
If you’re an individual trader, contact Rob Quinn at [email protected] or https://www.marketgauge.com/call
If you’re looking for asset management or you are an asset manager looking to help your clients, contact Ben Scheibe at [email protected]
Have a great week,
Geoff
 |
 Every week we review the big picture of the market's technical condition as seen through the lens of our Big View data charts. Every week we review the big picture of the market's technical condition as seen through the lens of our Big View data charts.
The bullets provide a quick summary organized by conditions we see as being risk-on, risk-off, or neutral. The video analysis dives deeper. |
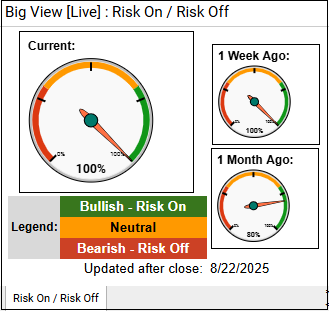
Summary: Markets flipped decisively risk-on after Powell’s dovish comments sparked a Friday surge, pushing DIA to new all-time highs and IWM to 2025 highs, with broad sector strength, improving internals, expanding breadth, and record-low volatility readings. While seasonals remain supportive into the end of August and foreign equities confirmed the breakout, some caution lingers as short-term overbought signals appear in small caps, volume patterns are mixed, and inflationary pressure plus weak seasonality in September may temper momentum.
Risk On
Neutral
For Actionable Trading Guidance:
1. Lean Into Risk-On Momentum (But Watch Overbought Levels)
2. Sector & Rotation Opportunities
3. Market Internals & Breadth Plays
4. Global & Alternative Assets
5. Seasonal Awareness

Every week you'll gain actionable insight with:


