August 7, 2022
Weekly Market Outlook
By Keith Schneider
 The investment markets have whimpered into August after a huge record-breaking stock market rally in July, encouraged by declining long-term interest rates.
Why?
What’s next?
We’ve heard many explanations, including “digesting the gains” to a “period of consolidation” to “that must have been a bear market rally.
Friends of ours frequently comment that they like the tone and tenor of these Market Outlooks, especially since last fall when we began consistently warning our readers to be careful and evaluate risk more closely.
It started in November with, “Something Stinks.”
Others, however, have commented that “you have a negative bias” or that you should “consider lightening up - things, are not that bad.”
I offer these quotes to sum up our desire to present the truth as we see it, always knowing that you are the final arbiter.
“An investment in knowledge pays the best interest.”
– Benjamin Franklin
“If you have trouble imagining a 20% loss in the stock market, you shouldn’t be in stocks.”
– John Bogle
I point out that lately, we have changed our stance to one that is more neutral.
If you have watched Keith’s recent videos and read our Big View bullets, you will notice that many of our technical indicators began to improve in early July.
More importantly, several of our strategies flipped to Risk On, and went back into the market.
We watch other publishing entities, and we’re proud to say that we were early among many market timers. Our indicators have held up well thus far.
Since we began this company in the late 1990’s we have always subscribed to presenting the truth as we see it.
Through our free and premium Big View commentary weekly videos, and members only training sessions, we provide the backup data so you can see how, why, and when we’ve arrived at our base case conclusion(s).
Knowledge is power, and we want to give you the power to execute your investment or trading strategy with good reasoning.
You might also note that last week’s article was about Mixed Signals (click here to see it).
“Mixed” suggested that one could easily interpret a bullish or bearish sentiment from all of the economic indicators, charts, and commentary we presented.
Still, many positives have the shadow of a potential contradiction. We lay out some of these below.
THE BIG THREE
Lately, an increasing number of respected economists and analysts on Wall Street have been suggesting an oncoming contraction.
We’d like to point out that the market’s inputs are largely swayed by the BIG 3: Earnings, Interest Rates, and Inflation.
Of course, there are other factors that contribute heavily to the inevitable trajectory of the markets, such as consumer sentiment, investor sentiment, natural cycles of the markets, employment, and the forecasts of economic growth.
These all influence the BIG 3, so let’s go through a few and their impact on the perception that things are getting better or worse in the economy and therefore having some influence on the markets, good or bad.
(Please note, last week we said that Good is Bad and Bad is sometimes interpreted as Good for the market).
Let’s take a look at some of these other indicators and what they might be saying about the market:
Employment
On Friday morning, we got the July employment numbers. The consensus expectation was in the low 200k range for new jobs.
Instead, we got a blow out number of 528,000 new jobs created in July!
There was a heavy emphasis on service employment (no surprise). This was initially interpreted negatively by the markets, which opened weak, but recovered most of the losses by day’s end.
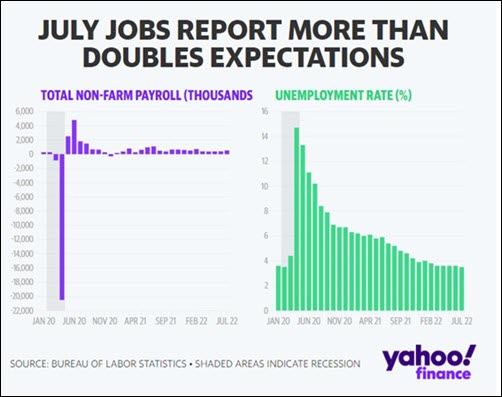
The interpretation: the Fed would have to continue maintaining their hawkish stance, and they could now easily bump interest rates at their next interval by another 75 basis points, something that everyone thought was off the table, especially when Jerome Powell intimated that they were getting close to a neutral posture. This belief helped the market rally over the past few weeks.
We have previously stated that we do not know if we’re in a recession or not. However, this week’s employment data certainly indicates that if we are in a recession, this is a very different one indeed.
We do believe that we have hit the full recovery mode, which should lead to our Large Cap Leaders models to continue to outperform.
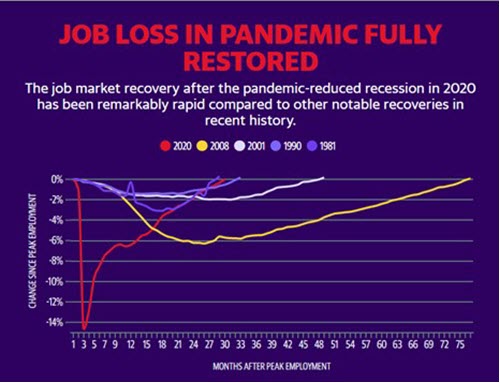
We are in a full employment economy with unemployment at 3.5%.
Wildcard: While the economy has returned to pre-pandemic employment levels, many companies are now slowing their hiring (or have suspended all new hires and interns). Full employment will continue to put pressure on inflation and may pressure the Fed to continue its aggressive tightening. This may be negative for the stock market (and bond market).
Inflation Declining?
We have written repeatedly about the insidious nature of inflation and the punishing effect it has on everyone in one form or another. Inflation should remain above the Fed’s target rate for quite some time.
However, as pointed out in recent Market Outlooks, we do see commodity prices (including energy) coming down. The great market technician Larry Williams pointed out in a recent video for StockCharts that inflation follows the rate of change in Money Supply (M2), and if you chart inflation with the 12-month change in M2 pushed 18 months forward, the correlation is impressive. See the chart below.
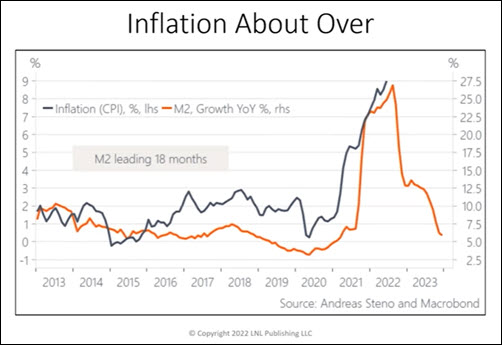
With the Federal Reserve purposefully working to reduce M2, inflation should trend down over the next few months. This could be helpful to the market, interest rates, and stock valuations.
Inflation Wildcard: If the Fed is unable to slow the economy fast enough or create demand destruction from higher borrowing costs, they will continue raising rates. While we are at 2.75% in Fed overnight borrowing today with early targets of 3.25%-3.50%, if inflation persists, you might see the Fed hike to over 4.0%. This may be very negative for the markets.
Housing
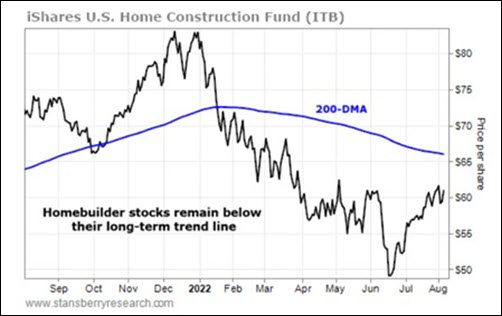
Home purchases came to an abrupt stop a few months ago. Many hot housing markets began to see a cooling off. The affordability index made up of the cost of houses and mortgage rates has recently shown that with financing, home purchases have now become out of reach for many new home buyers.
The following two charts create wishful thinking that we may be seeing a renewed housing market. Mortgage rates peaked in June and have started coming down. Homebuilder stocks are doing better, although still below their 200 DMA and in a bearish phase. However, this is a vital part of the economy and one we will continue watching closely for more positive signs.
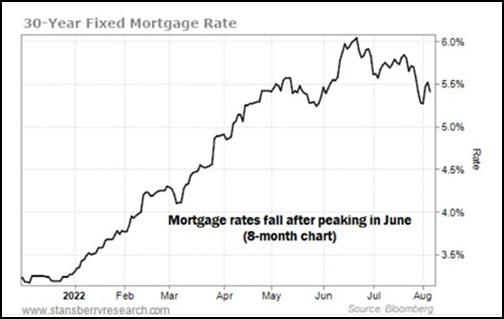
Housing Market Wildcard: After a multi-week rally in the bond market, interest rates began rising again this past week. Much of this was due to the positive economic numbers, including Friday’s employment report.
If rates again rise and take with them higher mortgage rates, all bets are off that the housing market will recover from its recent slowdown. This would be negative for the stock market.
Stock Market Metrics and Valuations
We want to share with you a few more charts and our interpretation of why these metrics may be valuable for the stock market going forward.
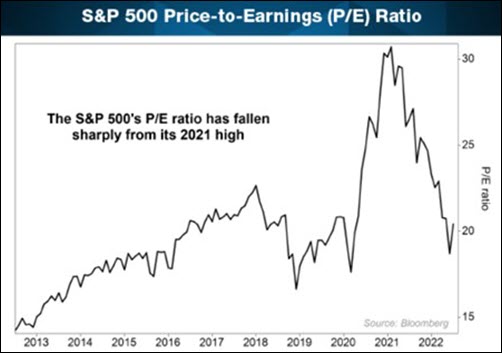
The following chart of Price/Earnings of the S&P 500 shows just how far valuations of the market have fallen. This could be interpreted as a positive or negative. This could mean valuations continue to get worse or we find ourselves at a point where stocks become more attractive. We would hope that it is the latter.
Earning Update: According to FactSet, 87% of S&P 500 companies have reported their Q2 2022 results with 75% beating their earnings estimates and 70% reporting revenues above estimates. This shows earnings growth rates firmly in the camp of 4%-6% growth this quarter.
Earnings Wildcard: Much of earnings growth has emanated from higher revenues created as a direct result of rising costs over the past year.
Will these higher costs begin to translate into demand destruction as people decide where to put their purchases?
If borrowing costs go up dramatically, as they have already, this should dampen consumption and eventually show up in earnings. We may see an earnings contraction over the next year, which will reprice the stock market again.
Consumer Sentiment
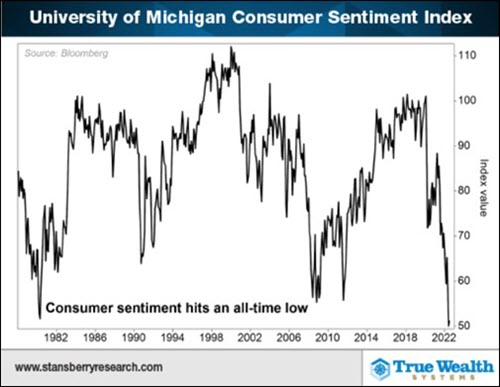
Last week we commented about various economic indicators (LEI, PMI, etc.). Consumer Sentiment is often perceived as a contrarian indicator. We believe that when sentiment gets this negative much of the bad news may be already priced into the market. Take a look at the chart below to get a good idea of how negative sentiment has become.
Please note that we last witnessed sentiment get this low in early 2009 when we came out of the last severe recession and in 1982 as we started to recover from the inflationary years of the late 1970s.
Sentiment Wildcard: If mortgage rates were to continue rising, inflation stays high, and earnings falter, then sentiment may stay low for an extended period of time. That will not help the rebound in stock prices continue.
Bear Market
Please remember that we remain in a bear market. That means we fell beyond 20% in the S&P 500. Bear markets are famously known for having fits and starts that make it appear that we have seen a bottom in the stock market. These “bear” rallies are a clever way to attract fresh capital and new buying only to be sent further down. The market is famous for doing this.
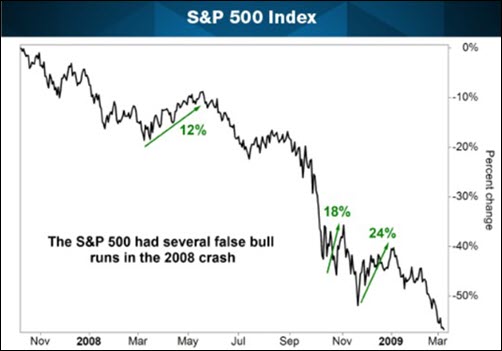
Wildcard: The recent rally may be a BEAR MARKET RALLY. So please manage your risk appropriately.
Follow our weekly commentary, check the updates on our Risk Gauges in Big View, and if you have not done so already, utilize the additional investment strategies that we offer. Mish’s Premium, CryptoPulse Quant, and 4 of our Quant-Algo investment models are all positive on the year, with 3 of these up double digits for 2022.
-
Here is our weekly summary from this week’s Big View:
Risk-On
Risk-Off
Neutral
Due to travel there will not be a video this week.

Every week you'll gain actionable insight with:


