February 1, 2026
Weekly Market Outlook
By Geoff Bysshe

Last week ended with the fireworks of:
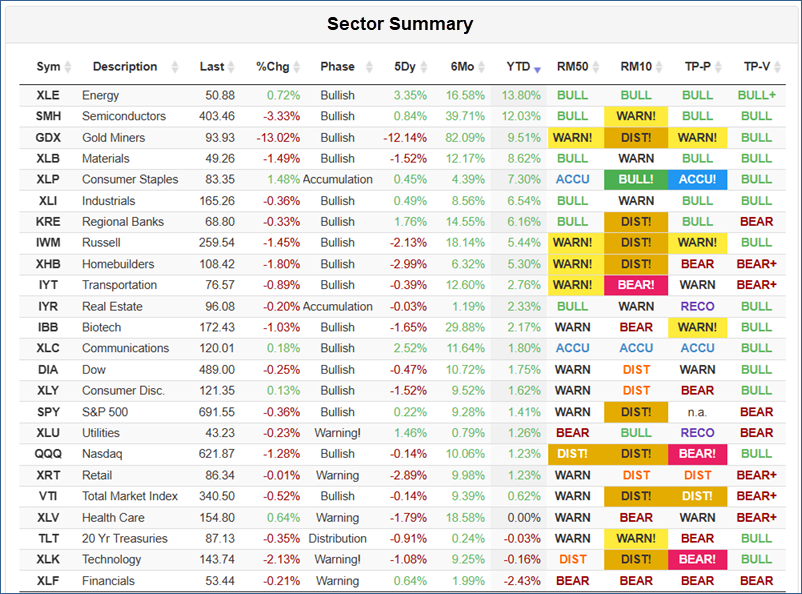
As you can see in the 5-day change column (5Dy) of the Big View Sector Summary table below, stock indexes and the long bonds took it all in stride. The SPY and QQQ closed virtually unchanged.
The IWM, which started the week up over 7% for the year, gave back a modest 2%, and the long bond ETF (TLT) slipped less than 1%.
Why Is The Fed Nominee Such Bad News For Gold and Silver (and Fine For Stocks)?
The shiny metals melted down shortly after the news of President Trump’s nominee for Fed Governor, Kevin Warsh. Why?
How can he have such an impact on gold and silver without any impact on the stock indexes? This is just one of several contradictions the markets either presented or digested last week.
More importantly, will the meltdown in Gold and Silver of about 20% and over 30% respectively mark the top of a euphoric run or a second chance opportunity to buy a secular bull trend at a discount?
Another potentially confusing narrative was that both MSFT and META beat earnings expectations last week, but one flew while the other flopped.
One reason this divergence can easily happen is that Wall Street’s speculative animal spirits are still alive and well. How else could TSLA announce that it is cutting back on the manufacturing of cars, from which it gets 70% of its revenue, and replacing it with the manufacturing of robots for which there is no demonstrable demand, and zero revenue?
In bull markets, high valuations are easily supported by animal spirits filled with optimism and FOMO, but, as gold and silver demonstrated, these animal spirits of support are also vulnerable to the other popular Wall St. saying: “easy come, easy go.”
Next week, roughly 20% of the S&P 500 companies will report earnings, and the market will get the monthly employment report.
Last week shed light on what to expect going forward.
What Was Really Behind The Precious Metal’s Meltdown?
Why Precious Metals Got Hit So Hard on the Kevin Warsh Nomination
There are some logical reasons for the precious metals to sell off with this nomination, but the size and speed of the violent correction were more of a function of market positioning.
Long-term structural trends are built on facts, but short and intermediate-term swings are often driven by market positioning and human emotions.
The extended bullish trend in both gold and silver had recently entered a parabolic condition. This condition, like its alter ego – the capitulation collapse, both tend to reverse in ways that are similar to their initial move.
The media was quick to point out that silver dropped $40 in two days, but was less interested in the fact that it was at the same level it had traded just two weeks ago. Friday’s close in gold is the same level it traded at just 6 days ago.
The volatile price action on Thursday suggested that the market was susceptible to a fearful liquidation driven by profit-taking and risk-reducing traders even without a bearish catalyst.
Kevin Warsh, however, is a bearish catalyst.
As a result, his nomination provided the catalyst that accelerated an overdue period of profit-taking, leading to a crowded trade lacking the liquidity needed for an orderly correction.
How To Trade The Metals Now
These markets are global, and the long-term structural demand for them will not be changed by this nomination.
However, the violent nature of the move is the type of pattern that can indicate or create a real reduction in speculative demand for some time. This can be measured using Market Phases determined by the 50 and 200-day moving averages and the January calendar ranges, which we speak about extensively here.
The short answer is that a market in a bullish phase and positioned above the January calendar range can be traded with a bullish bias in a risk-managed way.
It is not surprising that Gold’s collapse bounced from the top of its calendar range. See the chart below.
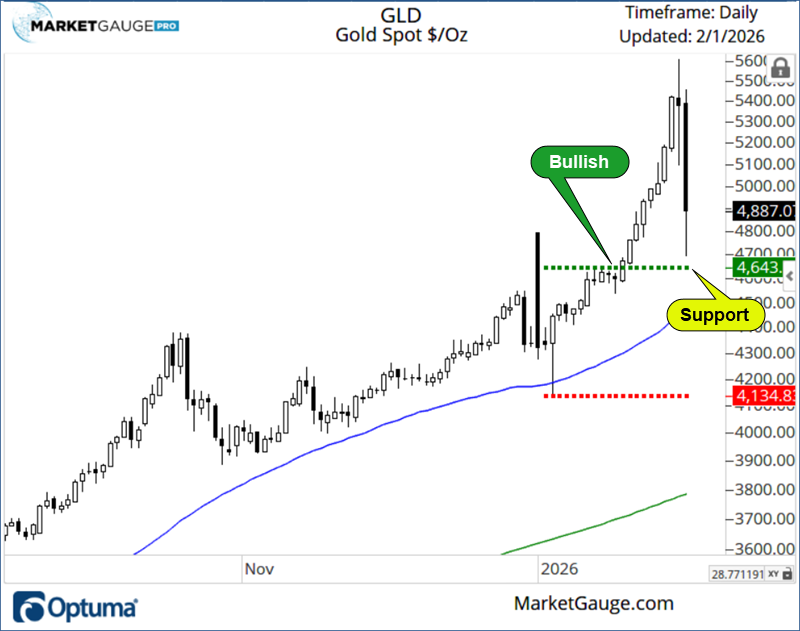
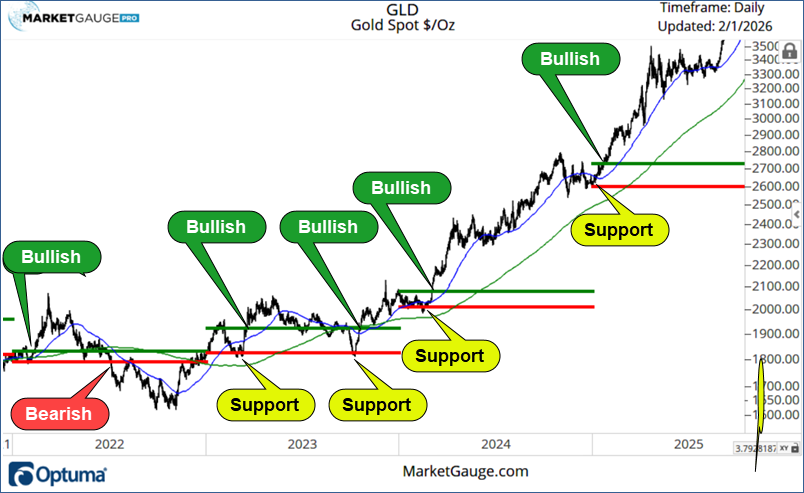
As you can see in the chart below, the 50 (blue) and 200 (green) DMAs and Market Phases, and the January Calendar Range high (green) and low (red) have provided very reliable levels for anticipating the right market bias for gold.
One simple approach would be “neutral” under the Calendar Range high and bearish under the low. Until then, the long-term trends remain bullish, the short-term volatility needs more short-term tactics.
MSFT Falls, META Flies, and TSLA Pivots
Last week, in our trading room mentoring sessions, I said I was waiting for the market to tell us its bias through its response to the MSFT and META earnings.
It was very clearly a split decision, and the market’s response was equally mixed.
Why MSFT Fell: “Great quarter” wasn’t the point—the AI narrative was
Microsoft’s drop wasn’t about collapsing demand. It was about expectations and the “AI hyper-growth, low-risk” story hitting a speed bump.
What spooked investors:
Microsoft didn’t have bad numbers; it had a disappointing narrative.
Why META Flew: AI spend looked “expensive” but productive.
Meta delivered what the market wanted: proof that AI isn’t just a cost center.
The key difference vs. Microsoft wasn’t the existence of capex—it was the framing:
So META ran higher because it gave the market a clean message: AI can expand the profit pool, even during peak spend. This will likely continue if market sentiment continues to be optimistic.
TSLA’s Pivot Shows Off The Bulls' Persistence
Tesla’s earnings reinforced a strategic shift that investors have been debating for years, but now Tesla is making it explicit: robotaxis + Optimus + AI infrastructure are the centerpiece.
From the reporting last week:
The market implication: TSLA is increasingly priced like an AI/robotics option. That widens the outcome distribution:
Few CEO’s can pivot like Elon, but this pivot clearly shows the bulls still believe in the enormous promises of AI.
As we move through earnings season, almost every company will be judged based on how tied its future is to the AI trends, and for those that are heavily influenced, investors should be evaluating what kind of investors are in control of the trend.
If you'd like access to the MarketGauge indicators, strategies, automated trading models, and more, contact us.
Best wishes for your trading,
Geoff Bysshe
 |
 Every week we review the big picture of the market's technical condition as seen through the lens of our Big View data charts. Every week we review the big picture of the market's technical condition as seen through the lens of our Big View data charts.
The bullets provide a quick summary organized by conditions we see as being risk-on, risk-off, or neutral. The video analysis dives deeper. |
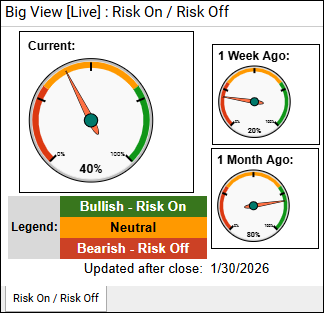
Summary: Markets remain risk-on but weakening, with bullish phases intact across indexes and supportive seasonality into mid-February, even as momentum fades, leadership narrows, and value continues to outperform lagging growth. Risk is rising, with deteriorating market internals, mixed breadth and volume, warning phases in tech and growth, a volatility uptick, and renewed pressure from macro cross-currents like the dollar, commodities, and crypto.
Risk On
Neutral
Risk Off
Maintain a measured risk-on posture, but recognize that the market is transitioning into a more fragile phase as momentum wanes and market internals weaken. While longer-term market phases remain bullish and seasonal trends are supportive through mid-February, the deterioration in breadth, leadership, and growth momentum argues for more selective positioning and tighter risk control rather than broad exposure.
Equity positioning should favor relative strength and defensive leadership. Continue to overweight areas showing resilience such as value-oriented exposures, energy, and utilities, which are benefiting from macro uncertainty and shifting leadership. Avoid adding exposure to technology, growth, retail, and healthcare, particularly where warning phases and poor internals are already evident. Any rallies in these weaker groups should be treated as counter-trend or tactical unless internal indicators materially improve.
Risk management should be proactive, not reactive. Position sizes should be reduced from aggressive levels, stops should be tightened, and portfolios should be reviewed with the assumption that volatility may expand. If volatility continues to break out or market internals deteriorate further (breadth, advance-decline, up/down volume), exposure should be reduced promptly rather than waiting for index-level breakdowns.
Remain flexible across asset classes. Commodities and precious metals experienced sharp downside reversals and should be approached cautiously until price and momentum stabilize. Rising geopolitical uncertainty and weather-driven energy moves argue for tactical exposure rather than long-term conviction trades. Bitcoin’s failure to hold recent support reinforces the need to keep speculative assets underweight until risk appetite improves.
Cash remains a valid allocation. With mixed signals across equities, rates, currencies, and commodities, maintaining dry powder allows portfolios to respond quickly to either renewed risk-on confirmation or a broader risk-off transition. Re-engage more aggressively only if market internals stabilize and leadership broadens back toward growth and technology.

Every week you'll gain actionable insight with: