October 19, 2025
Weekly Market Outlook
By Geoff Bysshe

Last Monday, the week began with a strong rebound from the prior Friday’s significant selloff, but Tuesday found itself testing the prior week’s lows within the first 30 minutes of trading.
Fortunately, Tuesday’s AM weakness set up a reversal that led to a rebound that cemented the week’s low.
The rebound continued to new weekly highs on Wednesday, but the strength quickly faded and tested the resolve of bullish traders as it slid to be down on the day before settling modestly higher.
On Thursday, investors were spooked by the ghost of regional bank “credit concerns,” which dragged the whole market lower.
While the stocks didn’t make new lows for the week, the VIX (shown below) made a new high for the week on Thursday and Friday. Investors were jittery!
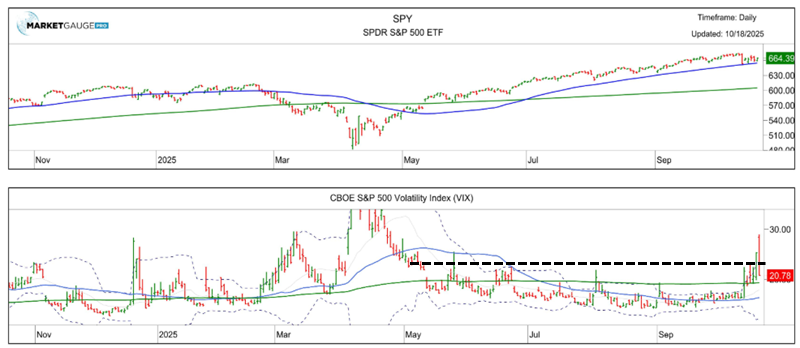
Fortunately, the volatility calmed down on Friday, markets drifted higher, and the final scores for the week looked like a win for the stock indexes.
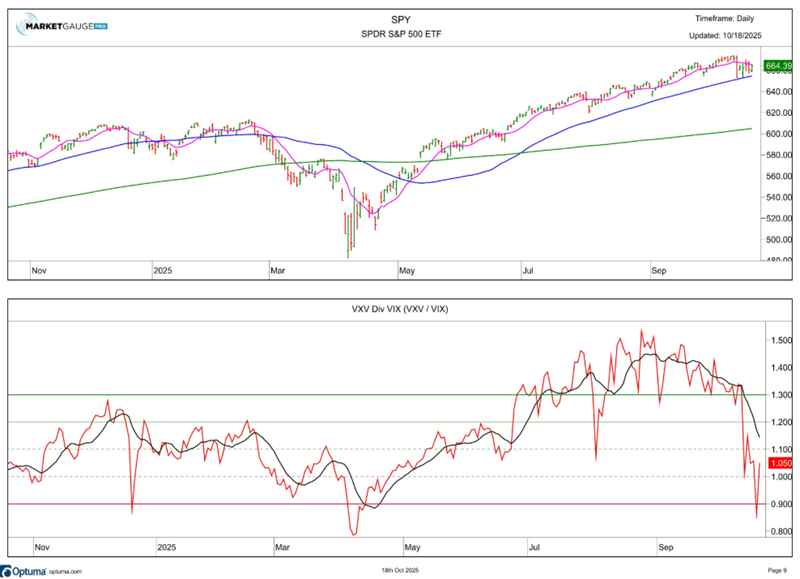
Another view of the VIX, shown below and found in Big View here, reached a level that has been indicative of at least a temporary market bottom. However, the spike to a low is only the first half of a “bottom” pattern. A continued rebound in this ratio would be needed to confirm that a fear-based bottom was set.
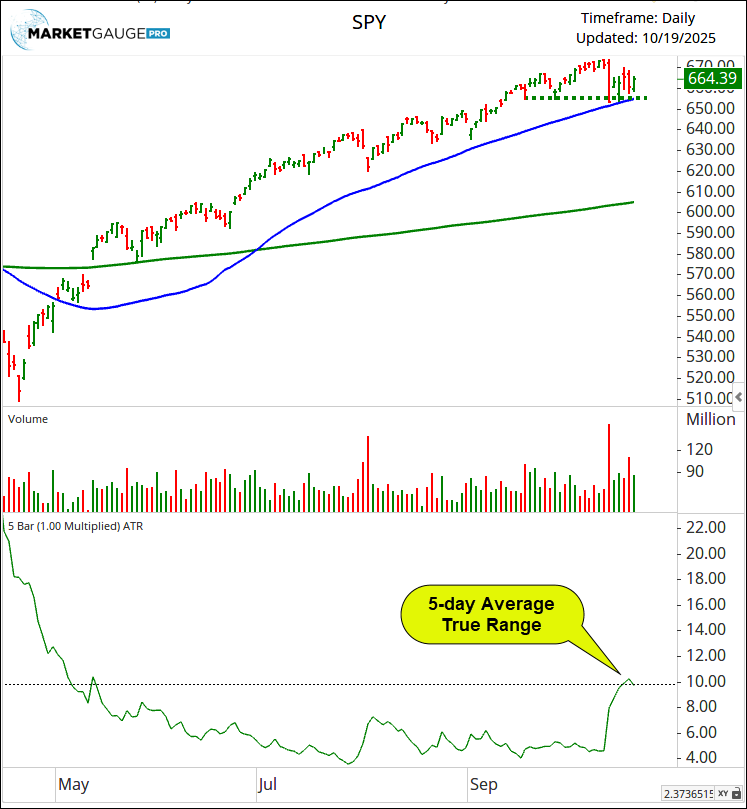
The price action of the week was all contained within the prior Friday’s range, which created a consolidation pattern wedged between the 50-day and 10-day moving average. However, as you can see from the chart below, the consolidation was also the most volatile week the S&P 500 has experienced since early May, when volatility was still recovering from the April bear market.
You can see the volatility in the 5-day average true range indicator below which captures weekly volatility of individual days.
Are Investors Afraid of The Dark?
With the government shutdown showing no signs of ending, the stream of normal data that is noticeably missing from investors’ daily routine feels a lot like losing power and your lights at night.
The timing of this lack of insight is also a bit nerve-racking, considering the market is concerned about China turning up the heat on Trump in the trade war, the labor market slowing from an unusual “no hire, no fire” position, and equity valuations considered to be historically high.
The Other Reason Markets Are Jittery
One reason markets often react to news in a counterintuitive way is that “positioning” impacts actions.
Simply put, if you’re fully invested with no desire or ability to buy more, all you’re going to do is hold or sell. Additionally, you may be more likely to sell some of your holdings if you’re fully invested than if you had 50% cash.
How you’re positioned impacts how you’re likely to respond to market news and moves.
With this in mind, consider the two charts below.
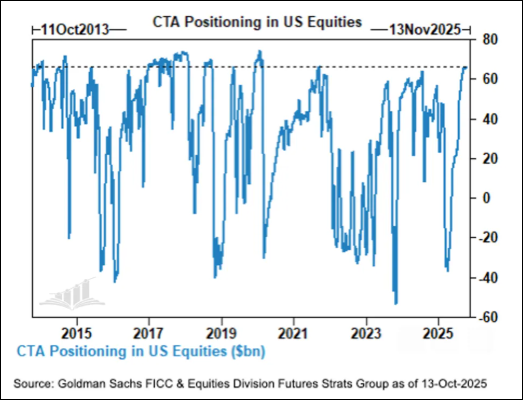
Goldman Sachs released this chart showing an active investing segment of the market, CTAs. CTAs are Commodity Trading Advisors who manage client futures accounts in all types of instruments, including stock futures. As you can see, the CTAs are historically “fully invested.”
Deutsche Bank released a different version of positioning in the market. This chart below is not specifically CTAs, and it has an interesting breakdown of systematic vs. discretionary investors.
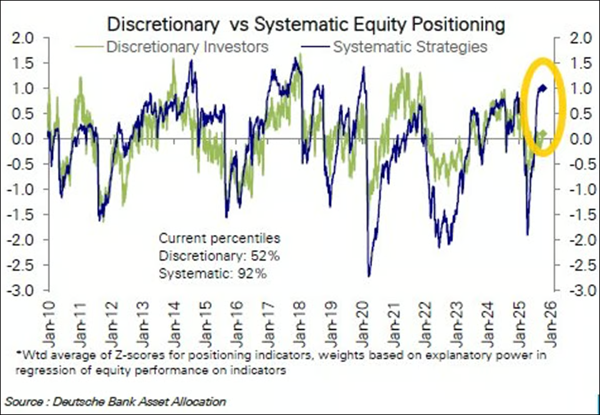
There are two messages here. First, the systems (machines) are pretty fully invested. Second, the humans are not bullishly positioned, which suggests they are nervous, but also potential new buyers. FOMO is a powerful force on humans, especially in the fourth quarter.
The Important Data Is About To Show Up - Earnings
Earnings season kicked off last week with the banks. The major banks reported strong results, which led to immediate pops that were then pulled back by regional bank credit quality concerns.
Over the next few weeks, there will be a flood of earnings data, and bulls are counting on this news keeping all the bearish geopolitical uncertainty at bay.
As you can see from the chart below, earnings estimates have been rising leading up to this reporting season.
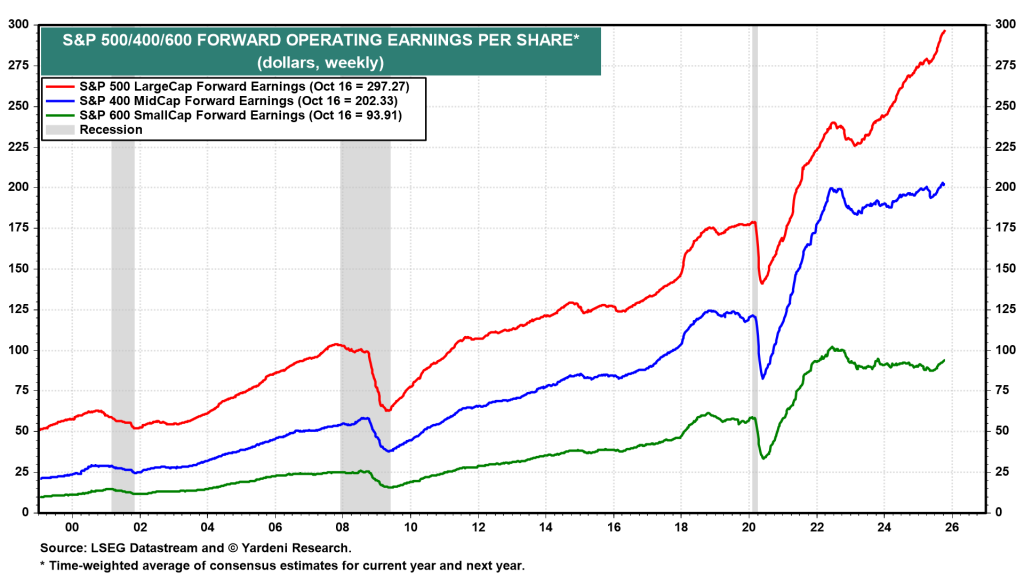
This trend in forward earnings is a double-edged sword. On the one hand, it has momentum and is a strong case for the market’s current valuation. On the other hand, it lends itself to earnings reports disappointing expectations.
As always, we’ll be watching the market's reaction to earnings reports very closely.
Key Market Inflection Points
Last week’s jittery, fearful market action set up a clear inflection point for the bulls. If the market breaks last week’s low and the 50-day moving average marked by the dashed line in the chart below, it will be a warning sign that more weakness may be on the way.
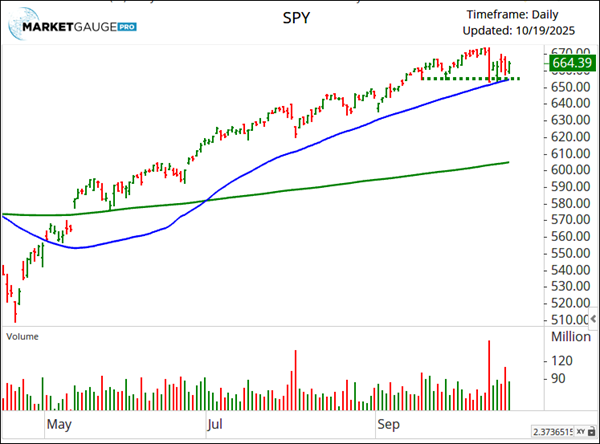
If the market breaks out to new highs, then the bulls have broken out after another minor correction.
Keep it simple.
Geoff
 |
 Every week we review the big picture of the market's technical condition as seen through the lens of our Big View data charts. Every week we review the big picture of the market's technical condition as seen through the lens of our Big View data charts.
The bullets provide a quick summary organized by conditions we see as being risk-on, risk-off, or neutral. The video analysis dives deeper. |
Market Summary
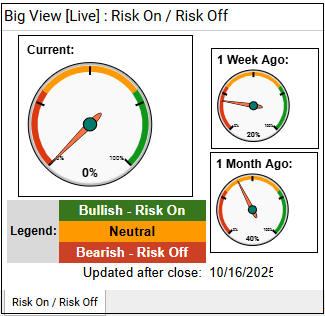
U.S. equities staged a strong rebound with broad participation across sectors—especially semiconductors—while the Economic Modern Family and global markets stayed in bullish phases supported by seasonally favorable trends. However, weak volume patterns, an elevated risk gauge, and lingering volatility suggest underlying caution despite improving internals and easing rates.
Risk On
Risk Off
Neutral
1. Core Market Bias: Selective Risk-On
Despite the official risk gauge remaining risk-off, the market’s strong rebound across major indexes and sectors—particularly semiconductors and global equities—suggests short-term momentum is turning bullish. The plan should lean risk-on, but with tight risk management given weak volume confirmation and elevated volatility.
2. Equity Positioning
3. Sector Rotation Opportunities
4. Hedge and Volatility Strategy
5. Macro and Intermarket Considerations
6. Tactical Outlook

Every week you'll gain actionable insight with:


