February 8, 2026
Weekly Market Outlook
By Geoff Bysshe
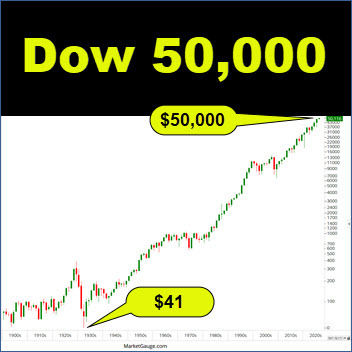
As the majority of market commentary focuses on the collapse of AI tech related stocks, there’s a new bull market making new highs.
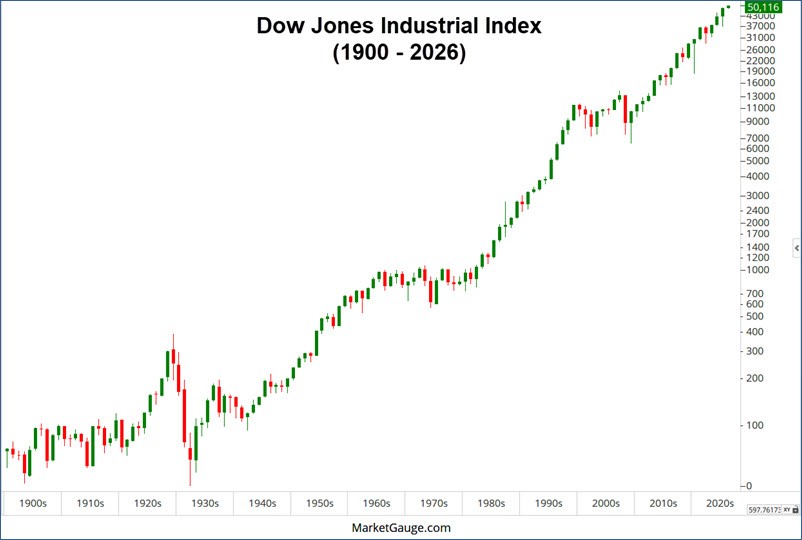
To be clear, the market and its index aren’t new. In fact, its chart below begins in January 1900 with an opening price of $68.
What is relatively new are the stocks that are driving the Dow and other important market indexes to new highs despite the collapse of the “Magnificent 7.”
These stocks shouldn't surprise readers of this column, as we’ve been writing for months about how to identify the stocks participating in the great rotation in the market. More on the leading stocks and sectors later.
Do You See This Pattern?
When I looked at the 125 years of yearly candles above, a pattern jumped out. I could also describe it as a “lack of a pattern” that hasn’t occurred since the 1929-1932 bear market. More specifically, the pattern is most notable on red candles.
The pattern is a lack of wicks (lines) above a red candle body.
Candle Charts Explained: A red body (the thick part of the bar) represents the situation where the open of the year is the high of the body and the close of the year is the bottom of the body. The wicks are the lines that extend beyond the open and the close of the year to form the year’s high and low. A green body means the market closed higher than it opened for the period (one year here).
No wicks above the open on red bars means that years that closed lower didn’t trade higher than their open.
In the 1929-32 bear market, there were substantial wicks above the opening price. Since then, my observation is that they are rare, especially in down years.
So you can protect yourself by being cautious when markets trade below their January Calendar Range low, and you won’t miss the good years if you’re focused on being long above the January Calendar Range high.
Sectors and stocks are more volatile, but the Calendar Range trading rules work well on them too.
This is why Big View’s Seasonality section provides the Calendar Ranges table below, which shows the main S&P 500 sectors’ locations relative to their multiple (January = six month) Calendar Ranges. We also have a scanner for stocks in our January Trend Trade and Calendar Ranges membership area. (contact Rob if you’d like to learn more: www.marketgauge.com/call)
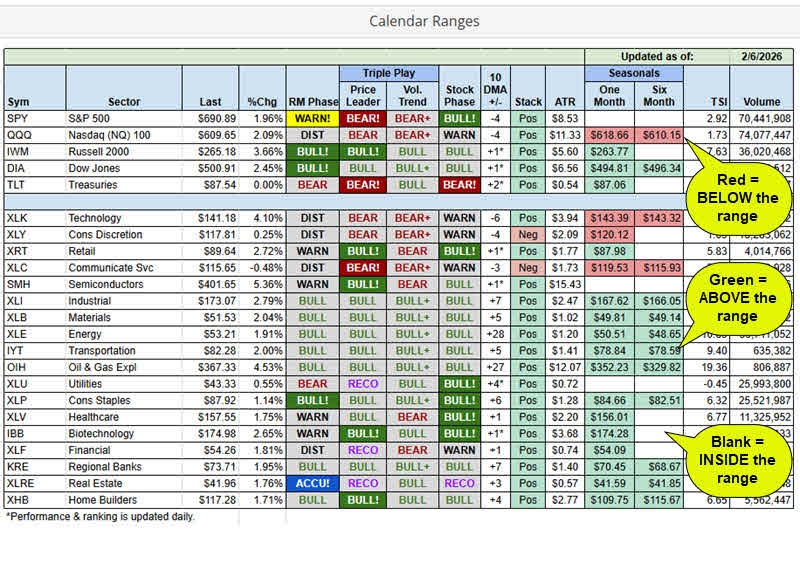
As you can see in the table above the only sectors trading below their January Calendar Range Low (Six Month) are two tech related sectors (XLC and XLK). There are 9 sectors which are higher.
That’s a healthy bull market from a sector breadth perspective.
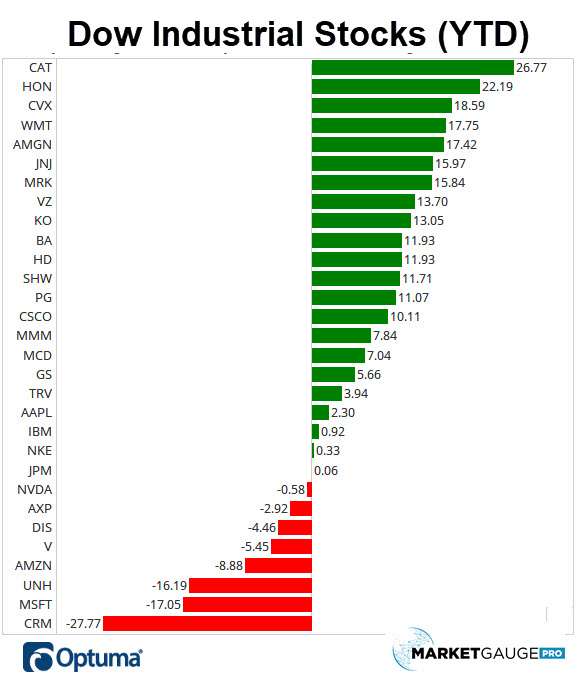
This breadth is why the Dow broke out to new highs (shown below).
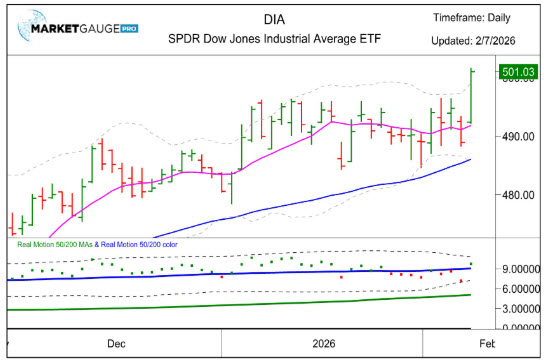
Fortunately for the Dow, not all tech is going down, and it contains several healthy tech stocks that counterbalance its bearish tech stocks. As you can see from the year-to-date chart of the Dow components below, it's broadly bullish.
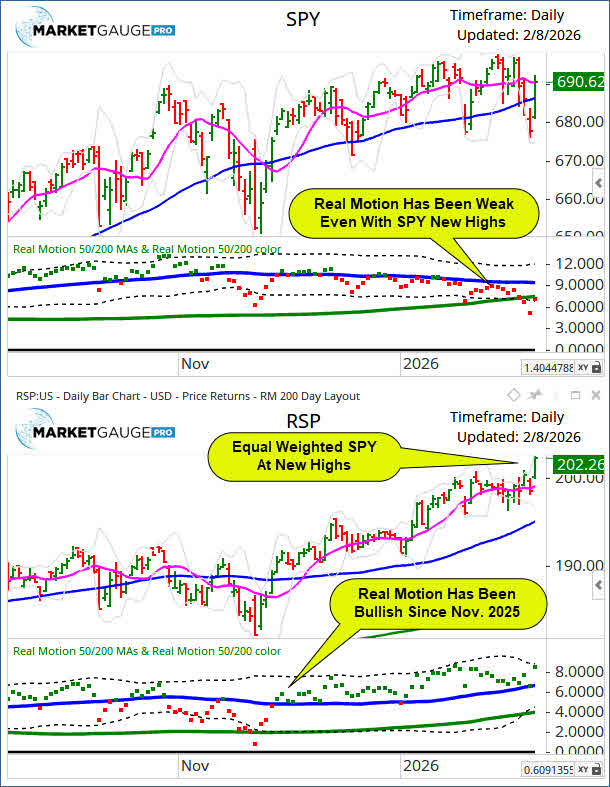
Strength is broader than just the Dow. As you can see below the equal weighted S&P 500 (RSP) also broke out to new highs last week.
Furthermore, RSP has been demonstrating better momentum (Real Motion) than the SPY since November 2025.
The New Bull Market, Same As The Old One, But Different
The bull market has matured into a new collection of leaders over the last several months. More recently, the last several weeks have tested the resolve of bullish investors as their favorite stocks have been correcting, and the expectations for Fed rate cuts have been declining.
Rather than running away from stocks, investors have rotated into lower valuations and other sectors.
About 60% of the S&P 500 have reported earnings for Q4 2025, and according to FactSet, 76% have reported EPS greater than estimates. This is slightly below the 5-year average and in line with the 10-year average.
Earnings season is on track to report double-digit year-over-year quarterly EPS growth. If this happens, it will be the fifth consecutive quarter of double-digit growth.
The earnings trajectory appears healthy and supportive of the broadening bull market thesis. However, the correction in many of the tech stocks isn’t based on companies missing earnings expectations or reducing earnings guidance. The “bad news” dragging down stocks is the “good news” that AI may actually improve productivity, which, unfortunately for some, will reduce hiring.
Right now, the AI narrative is under attack from all angles, it “costs too much to build out,” but when the R&D spending leads to a product functionality that works so well, it creates fear that companies will lose market share, and or hire fewer people.
Keep your eyes on the leading stocks and sectors of 2026, they’re not the same stocks and sectors that led 2023-2025, but they’re the new bull market now. It’s the same bull market as the last several years, but different.
If you'd like access to the MarketGauge indicators, strategies, automated trading models, and more, contact us.
Best wishes for your trading,
Geoff Bysshe
 |
 Every week we review the big picture of the market's technical condition as seen through the lens of our Big View data charts. Every week we review the big picture of the market's technical condition as seen through the lens of our Big View data charts.
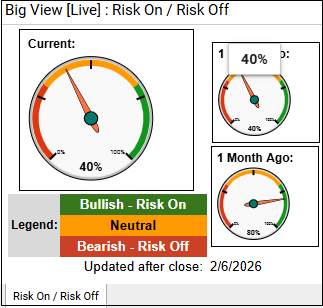
The bullets provide a quick summary organized by conditions we see as being risk-on, risk-off, or neutral. The video analysis dives deeper. |
Summary: Markets remain broadly risk-on as most indexes held bull phases (with leadership rotating into small caps and midcaps), sector breadth improved, and internals strengthened with the advance-decline line hitting new highs alongside strong seasonality into mid-February. However, Nasdaq-specific weakness, mixed volume confirmation, a negatively sloped new high/new low ratio, elevated volatility, and a sharp Bitcoin drawdown keep the backdrop cautious and prevent a full “all-clear” signal.
Risk On
Neutral
Risk Off

Every week you'll gain actionable insight with:


