April 23, 2023
Weekly Market Outlook
By Keith Schneider

Hi Gaugers. Hope you had a fruitful and prosperous week and are ready for some weekend relaxation in this mid-to late April period.
We’ve got something new for you this week.
Each week we strive to have our Outlook provide actionable insights that can unlock profitable investment opportunities.
We’re constantly seeking and uncovering areas of the market that you may not be noticing. We focus on data, trends, patterns, etc. that may influence a bias in the markets and highlight opportunities and situations you probably should avoid.
We draw from our internal resources and reach beyond our walls to find actionable insights wherever possible. If you have suggestions for us to consider, email me at [email protected].
Today, we are introducing a new source of insight that you can take advantage of all week long. Below you’ll find, “What’s Hot and What’s Not,” a summary of what themes seem to be working and what may be falling out of favor.
What’s Hot or What’s Not is taken directly from our Big View platform. Keith and company do a spectacular job of gleaning Big View and putting it into bullets as well as emphasizing it through his weekly videos.
We have learned that many of our readers and subscribers are unaware of just how powerful many sections of Big View can be for delivering early trends and ideas that are unfolding. Some people may not take the time to go in-depth with Big View, so we feel more inclined to share emerging investment constructs that may have an influence on the markets.
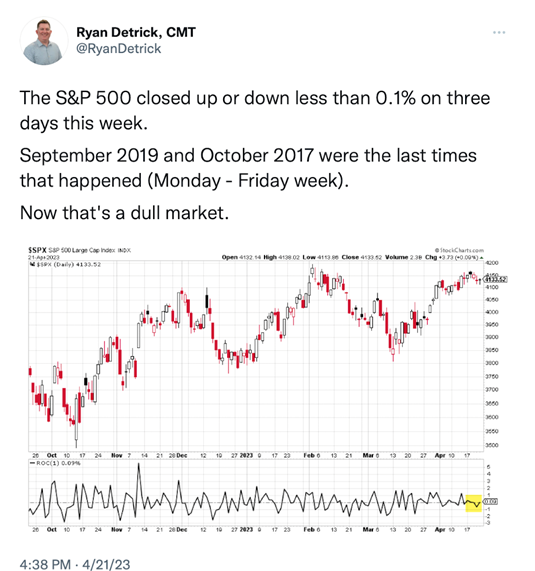
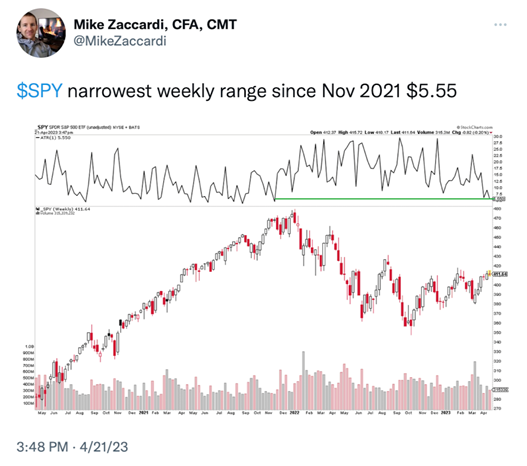
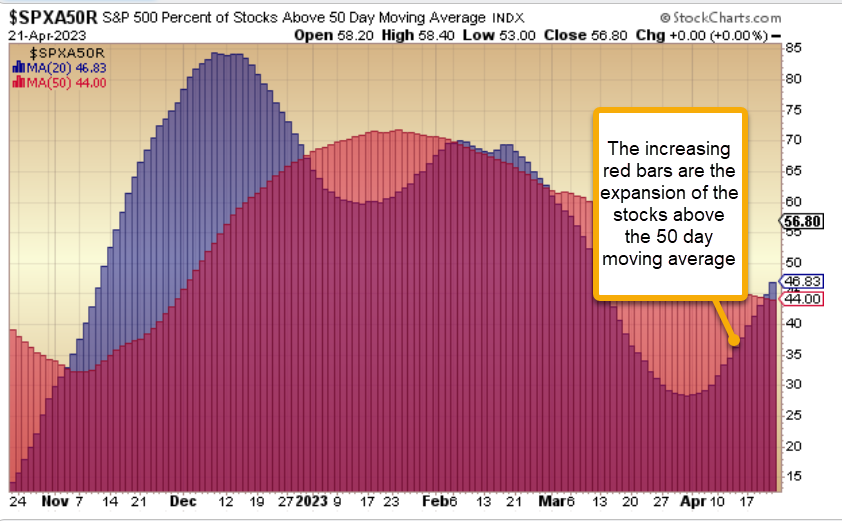
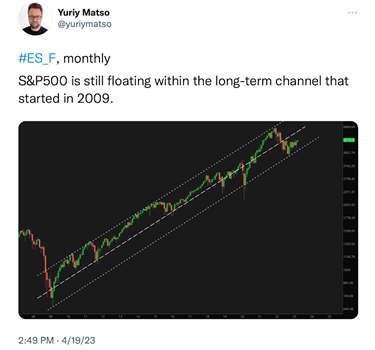
First, let’s cover some of this week’s market activity. It was a quiet week, even with many companies announcing earnings. The S&P has not been this muted, without high volatility, since November 2021. See some of the charts indicating this below:
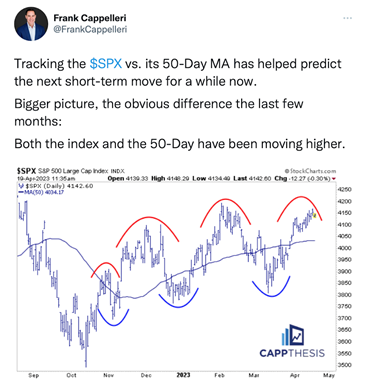
Some of the technical indicators we look at are the 20/50/200 day moving averages. Mish talks about these in depth in her book “Plant Your Money Tree,” and we use them to determine whether a stock or sector is in a bullish or bearish phase. Notice in the chart below that the 50-day moving average on the SPX continues to slope upward and is climbing that “wall of worry.” See chart below:
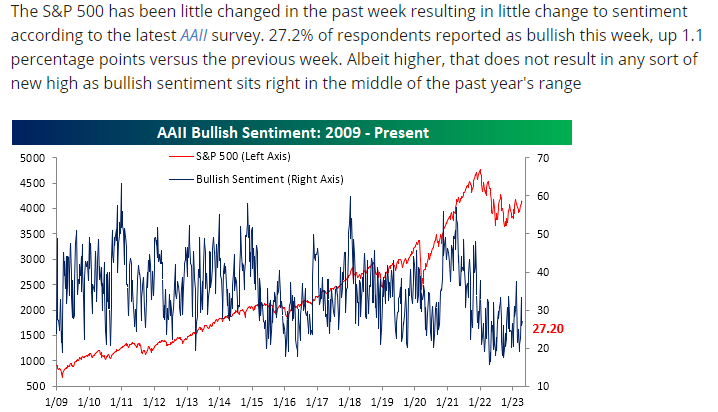
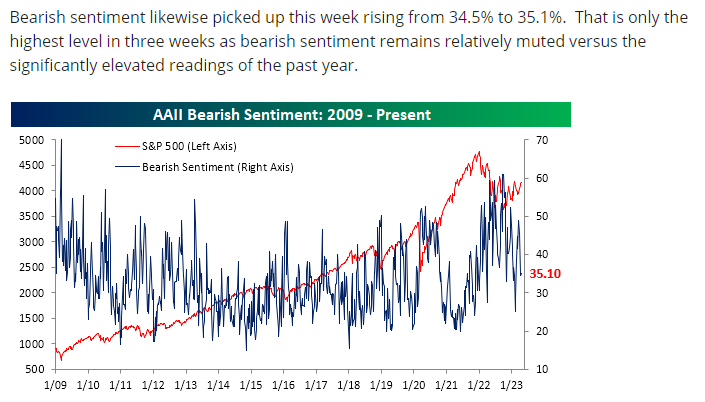
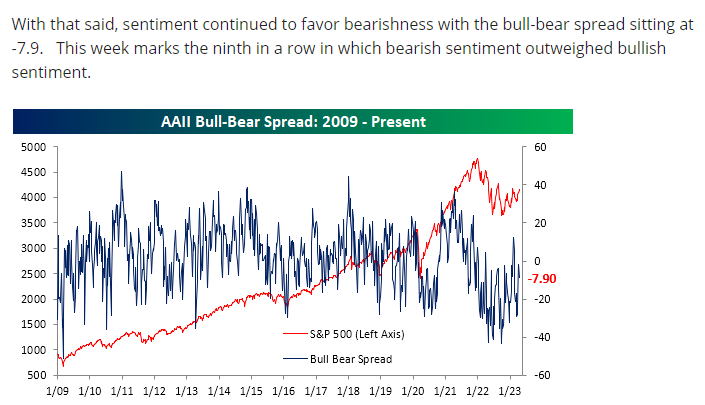
However, the current sentiment reading from AAII (American Association of Individual Investors) remains rather negative towards the markets. Small investors still maintain a negative bias, and the AAII sentiment readings continue to lean toward the bearish camp. As we have said before, this often can be a contrarian indicator. We continue to view it that way. See AAII charts below:
Why there may be reason to be more positive, at least in the short term.
Besides the positive slope of the 50-day moving average as shown above, there are a host of other reasons for us to maintain a positive outlook on the markets, at least in the near-term. A few of these reasons are:

-
-
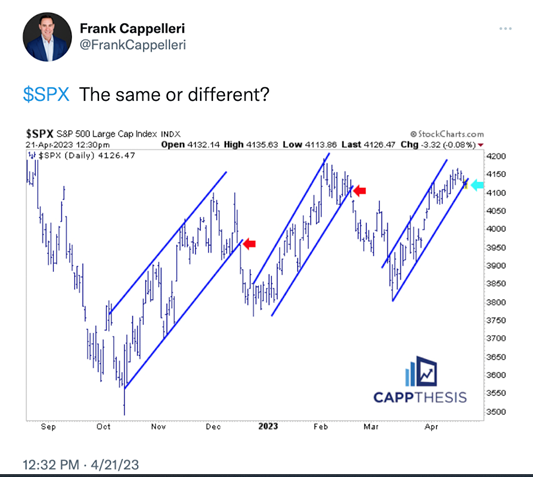
Can We Breakthrough?
We are at the precipice where the S&P (and QQQ as seen above) are challenging trendlines, support and resistance. We are at a pivotal point where we could go higher or sell off hard. Which will it be?
Earnings Season
Remember, we are in the middle of earnings season. According to Fact Set, 18% of companies have reported earnings for Q1 2023 so far. 76% have beaten their earnings expectations, and 63% have reported beating revenue expectations.
Last week we saw big earnings surprises for Proctor & Gamble (PG) and Tesla (TSLA). PG beat by a wide margin and TSLA missed. We suspect we may begin to see more beats and misses.
These two stocks also exemplify the two sides of the market (positive surprises and negative surprises).
PG is a consumer staple company benefiting from well-known and trusted brands. I suspect that inflation is driving higher revenues. Most consumers are sticking with their purchases of necessities, and PG earnings show that consumers are trusting well known established brands. It also shows that the consumer has not yet downgraded to more generic purchases.
On the other hand, Tesla sells an expensive electric vehicle which is NOT considered a necessity. Tesla is starting to see consumer pushback on its high prices, and they are viewing it as a luxury item, not a necessity. Their revenue and profit margins are declining due to several price reductions announced late last year and into 2023.
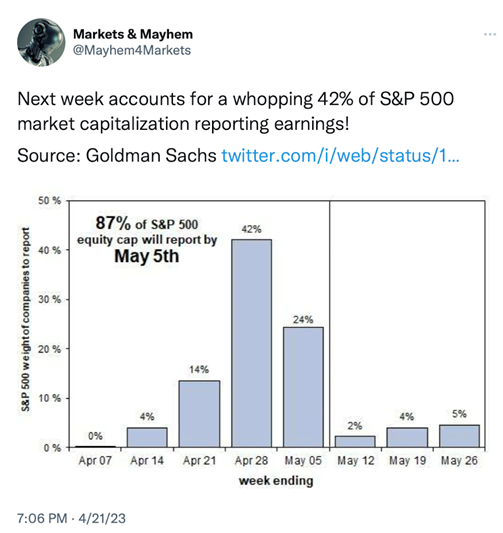
The BIG earnings are arriving this week. We will get a good view of current economic conditions from the earnings announcements from several mega-cap, large multi-national companies that make up 42% of the market cap weighting of the S&P 500.
What’s Hot and What’s Not

As mentioned above, we want to share with you some areas of the market our scans show strength. These are found in Big View.
We want to highlight them for you as we move forward. Perhaps they will generate some ideas of specific stocks or sectors that may be of interest to you.
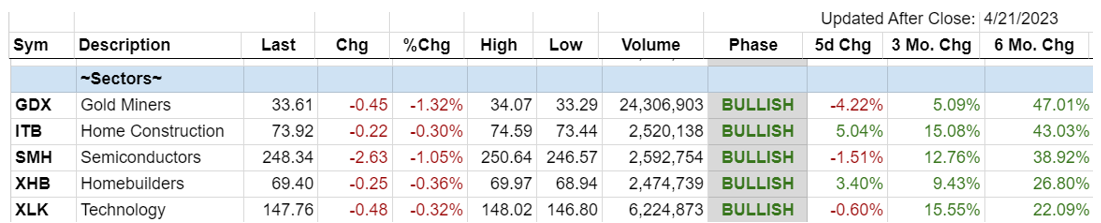
If you were to go through all our various quant-algo driven investment strategies, you would notice that they are littered with stocks that make up the above 5 areas. In Large Cap Leaders, for example, there are several technology companies, a semiconductor powerhouse, and a homebuilder all of which have experienced a good month of April, so far.
In NASDAQ All Stars equally impressive has been three technology stocks that have done most of the heavy lifting and propelled that strategy into double digit returns for 2023.
In GEMS (made up of Sector Rotation and Global Macro) most of the composition of these strategies is also from the above and below list of hot areas.
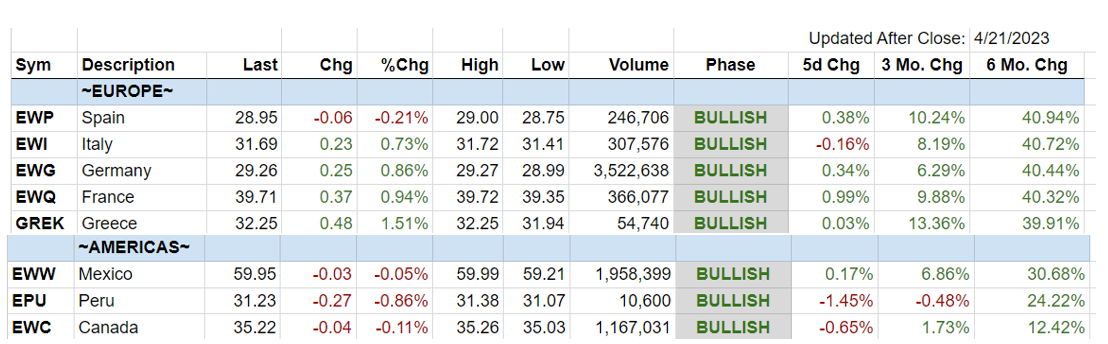
Outside the US, both Europe and South America are good candidates for your investment construct. They continue to remain bullish. See chart below:
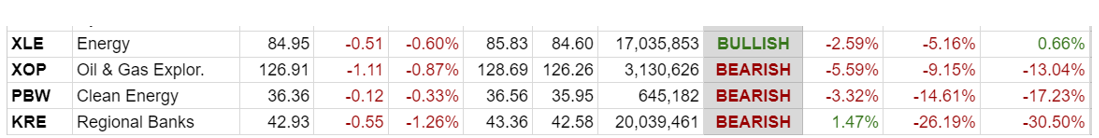
What’s Not
Energy continues to be a laggard as well as Regional Banks. Both areas that continue to endure heightened volatility and no clear trends.
These things are also discussed in more detail in the paid Big View section that follows this Weekly Insight commentary.
Speaking of our Investment Strategies
We started off the year in a positive fashion and have enjoyed the strength and momentum of several of our strategies. We still believe that combining them in an optimal fashion in one of our All Weather Blends is the best way to invest. We would enjoy sharing these Blends and other individual investment strategies (some only offered to MGAM clients). Please reach out to [email protected] or [email protected] or myself at [email protected].
Thanks for reading. Have a good, prosperous, and safe week ahead.
-
Now here are the additional inputs, guidance and takeaways from the summary of Big View in bullets and the weekly video by Keith.
Risk-On
Risk-Off
Neutral

Every week you'll gain actionable insight with:


