May 28, 2023
Weekly Market Outlook
By Keith Schneider

To the Men and Women of the Armed Forces: thank you for your service to our country. You have made a national promise to defend our freedoms and protect our way of life. You are the men and women who answered our call to duty, and you have served with distinction. Your courage, your sacrifice, your patriotism will never be forgotten.
Hello Gaugers. Hope that you were able to take advantage of a few of our profit-taking targets we hit on several stocks and ETFs in our investment strategies this past week. It was an unprecedented week after the malaise the markets had been going through over the past 16 months. Our quantitative and dynamic investment strategies once again identified emerging trends and momentum that allowed our subscribers and investors to reap the rewards from a few stocks/ETFs that had parabolic type moves. More on that later.
Economic Update
US inflation and consumer spending accelerated last month, highlighting steady price pressures and demand that might force the Federal Reserve to keep tightening - something we have repeated in this column recently.
Coming in at 4.7% YOY, the PCE indicated that inflation is persistent and not coming down anywhere close to targets soon.
Many of the media talking heads, along with economists and analysts at the major firms, had been talking about the low chances of additional Fed interest rate hikes. In fact, many of these same people have been forecasting interest rate cuts in the second half of 2023. We have pointed out that interest rates are likely to stay higher for longer.
Now the “betting” community has once again turned hawkish by the wholesale inflation numbers reported this week. The odds have now risen to 58% that the Fed will raise again at their next Open Market Committee Meeting in June and possibly July.
I recall Mish telling her followers and readers back in late 2021 that when inflation spikes it is very difficult to bring down. With 10 unprecedented Fed hikes in a 12-month period and inflation not trending down as expected, look to the Fed to cause more pain before things get much better.
The Fed’s hikes have led to an extremely inverted yield curve as measured by the 10-year Treasury minus the Fed Funds Rate. This is one reason why we maintain a position that a recession may be baked into the cake. Since 1971, this spread has inverted 7 times and each time was followed by a recession. That is a perfect track record. The chart below shows this relationship since 2000 with the last 3 recessions marked in gray. It also illustrates how deep the inversion is currently.

The early in the week head fake.
Our commentary last week included some technical interpretations that the markets were not seeing robust participation and the breadth of the markets was weak. One might have concluded that the markets were headed for a correction.
In fact, in evaluating many technical indicators that a large number of investment folks utilize, you might have concluded that the “rangebound” markets were still bouncing off of resistance at 4200.
Then we got stellar, unexpected earnings from several companies, including Nvidia (NVDA) and the markets shook off the malaise and took off, yet again.
The broad market (S&P 500) finally had a close above 4200, the top of the range that it had consistently been bouncing off. See chart below:

This week’s Big Winners.
The big winner was the NASDAQ 100 with the Semiconductor and Tech stocks, up over 3% for the week, while the Russell 2000 (IWM), Dow Jones (DIA), and S&P 500 were essentially flat on the week. A narrow field.

As previously pointed out, it was the big Mega Cap Technology stocks that won out over the last week. In our different investment strategies (NASDAQ All Stars, GEMS and Large Cap Leaders) we owned several of these, including Nvidia, which was a ballistic rocket.
Nvidia reported earnings on Wednesday night, and long before the market opened on Thursday, it was up over 25% in the pre-market.

I do not believe there is a time in history that a company increased its market cap by $250 billion in one day. It was such a big bump that the market cap appreciation from that one day was worth more in market cap value than the WHOLE value of 9 other large companies. See chart below:

Additionally, our subscribers and asset management clients were the other winners. Exposure to these explosive trends has led to a profitable week. Our investment strategies recognized the start of these trends a while ago and rotated to these growth areas of the market.
The Mega Cap Big Stocks just keep Getting Bigger
The mega caps’ influence on the indexes' performance is not limited to Nvida, and it’s at a record high.
Five stocks, Alphabet, Amazon, Apple, Microsoft, and now Nvidia, make up more than 23% of the S&P 500 (cap-weighted) index. See chart below:

If these seven stocks were an index (META, AMZN, MSFT, AAPL, GOOGL, NVDA and TSLA), it would be up 44% this year. If you remove these 7 stocks from the S&P 500 this year, the index is up just 1% this year. This means that the remaining 493 companies in the S&P 500 are up just 1% YTD. See chart below:

A huge difference between the S&P 500 Cap Weighted (SPY) and the S&P 500 Equal Weighted (RSP).
The markets are very narrow. This has caused many technical analysts to conclude that we were not seeing enough broad participation in the market and soon they would have to fall. Many of the comparisons of the S&P 500 cap weighted versus the equal weighted index have supported this.
No other year comes close to the influence these mega cap stocks have right now on the index. See summary below:

Beginning in February, the S&P 500 began its ascent driven heavily by a few large-cap stocks as outlined above. See chart below:

Year-to-date, the big winner thus far is the NASDAQ 100 (QQQ). The tech heavy index with the mega cap technology companies and semiconductor stocks, the current darlings of the investment world, continues to shine. Also, any mention of the AI (Artificial Intelligence) space has provided the tailwind for these stocks to begin selling at very lofty prices.
The Dow Jones Industrial Average with a more value tilt along with small-cap stocks (small companies) are both areas of the market that are not currently participating in this tech driven rally. See market comparison chart below:

However, if you look closely at the comparison of the NASDAQ 100 (QQQ), which is also cap-weighted and driven by the biggest mega cap stocks versus the NASDAQ 100 Equal Weighted (QQEW), you see the same conclusion as the S&P 500 chart above. Beginning in January, the mega cap stocks took off. See chart below:

Remembering the past. Are we setting up for a bubble?
I had the privilege of working for a growth manager during the latter 1990’s when the internet was a fairly new invention. I remember all too well that we had significant positions in the internet infrastructure build out stocks like Cisco (CSCO) and Qualcomm (QCOM) as they made similar parabolic moves back then. See charts below:


Please note that these charts are SPLIT ADJUSTED and back in 1999, these prices were many hundreds higher and unprecedented. Qualcomm was increasing its market cap by 2x on some days. Back then these were operating in rarified air. Similar to what we saw in Nvidia this past week.
Speaking of 1999, currently the 3 month differential between the cap weighted S&P 500 (SPY) and the equal weighted S&P 500 (RSP) is the widest since 1999. See chart below:

It is important to catch these trends, which our quant driven algorithms were able to do as they identified the start of a big trend:
I bring this up because it is important to stress that LOCKING IN PROFITS (pre-determined targets) is paramount for building wealth.
We cannot forget the past. I vividly recall the number of investors who told me back in the early 2000’s “that they were grieving at their lost profits.”
Are we in an AI bubble? I don’t know how the market reckons with stocks like Nvidia that make the largest jump in market cap ($250 billion) in one day. However, if you look at this current period versus the late 90’s, it doesn’t appear that we are in a bubble as yet. See chart below:

In fact, Semiconductor stocks, due to some of the latest technology improvements, the build out of larger US factories and their use in new AI technology, may just be getting started on a new innovation cycle. See chart below:

Where do we go from here?
As many of you know, I am an ardent fan of looking at the past and what recent history tells us about what we might see going forward. One of the best at this is Ryan Detrick (previously of LPL and now at the Carson Group) who conducts research on how the current market may resemble the past. We like to show his work from time to time.
The first item that caught our attention is the fact that we put in a significant low in October, 2022 and haven’t had another one since. To Ryan and a host of others, this implies that we started a new bull market and are unlikely (in their opinions) to see another low anytime soon. See chart below:

Moving forward, having the “last low” so far in the rearview mirror portends good things in the future as evidenced in the following chart:

Secondly, this past Thursday was the 100th trading day of 2023. When the S&P 500 is up greater than 7% at the 100 day mark, that usually means favorable stock market performance for the rest of the year. See chart below:

Last, when the NASDAQ 100 makes a new 52-week high after not having one for at least 6 months, that typically is evidence that bigger gains are going to come in the future. See chart below:

And the Other Winner Is?
YOU!. If you follow our strategies you are aware that we hit multiple targets on Thursday and Friday, locking in profits. We actually locked in two target profits in one day (at the open on Thursday) which is something we have not previously encountered.
This was part of our discussion in last week’s column. If you missed it, here is a link to read it:
And the Loser goes to?

This week’s investment loser goes to Cathie Wood. Her flagship ARK Innovations ETF cut its holding in Nvidia in January and missed out on the rally that added more than a half a trillion dollars in market value since January. She told Bloomberg TV that the computer-chip industry’s boom-bust cycle poses risks. Wood says when she hears “shortages, shortages, shortages about GPUs or anything, I begin to think about the cyclicality of a group.
MarketGauge’s Dynamic Quant-Based Algorithmic Strategies
Looking back in our history, MarketGauge was founded on the principle of providing better risk adjusted returns. The founders built various investment strategies on a formulaic quant based platform which has reaped huge benefits to the many subscribers who have followed us over the years. IT WORKS!
Collectively in the company we have investment professionals who have over 150 years of investment experience. Most of us go back to the late 70’s and 80’s in starting our investment careers. We have been through every type of market. These include the 10 years of the 1970s into the 1980’s when stocks went sideways. (Most of you know that this was in a similar high inflation cycle to what we are experiencing now) .
Many large and successful investment firms have been built on similar depth of investment experience but resort ONLY to a discretionary method of picking stocks. I worked for a NY firm that was successful but only had moments of brilliance in the 20 years I worked there.
At MarketGauge we have demonstrated that investing success can be executed consistently, with less risk and volatility and superior risk adjusted performance by utilizing formulaic investing (quant based algos) to do the heavy lifting.
We have proven, time and again, that our strategies do an excellent job of identifying early trends. Because trends can begin in fits and starts, sometimes we get in too early or out too late, but sticking with these strategies has provided good investment performance over time.
This week was one of those such weeks. Earlier this year we uncovered several new emerging trends and stuck with them. When the big moves happen, you have to be in them to win!
(Written in memory for a friend of a friend and a colleague of mine, Michael Zweig, nephew to Marty, who died a few weeks ago in Cleveland. Way too early.)
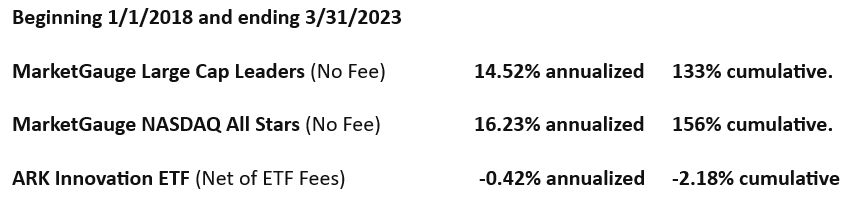
A quick comparison to show you the power of the MarketGauge strategies.
We have picked just two individual stock portfolios offered by MarketGauge to show the power of our algorithmic quant-based investing. Using the widely held ARKK fund as referenced above (it went from over $100 billion in 2021 to approximately $7 billion invested in the ETF), we want to show you a comparison of MarketGauge investing versus ARK investing:
This week’s Big View summary was contributed by Holden Milstein.

Risk-On
Risk-Off
Neutral
-
** Due to the holiday, there will not be a BigView video this week **

Every week you'll gain actionable insight with:


