December 7, 2025
Weekly Market Outlook
By Geoff Bysshe

Next week could set the tone for the much anticipated Santa Claus rally, but be patient.
The Fed’s interest rate decision and press conference on Wednesday are expected to deliver a 25 bps cut (as shown in the chart below), then the market will immediately focus on the odds of future cuts based on Chair Powell’s comments.
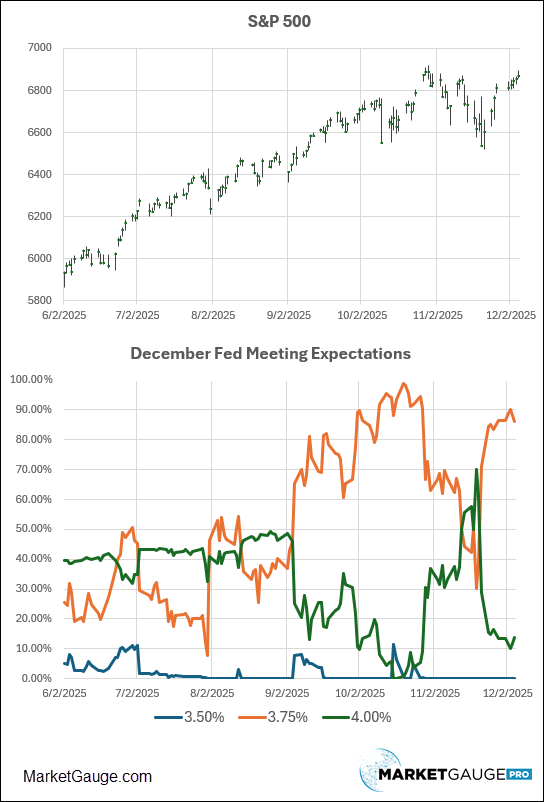
You don’t need to be an economist to see how closely the trend of the S&P has followed the expectations for this December’s rate cut. Market strategists have been trying to talk the market off the Fed rate cut addition, but I don’t see it happening in that chart. Do you?
Below, we’ll look at the chart of rate cut probabilities for the meeting we’ll be focused on to measure the market’s rate-cut dependency pressure well into 2026.
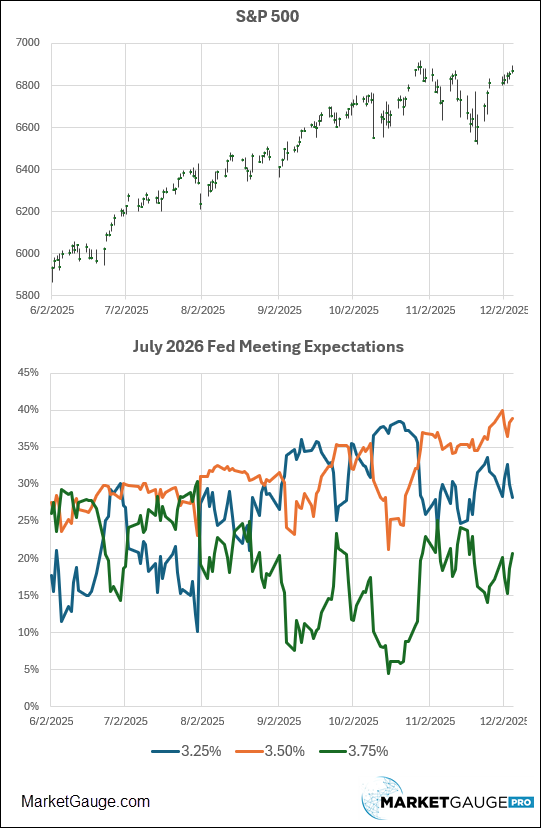
Since it’s widely accepted that President Trump will replace Chair Powell when his term ends in May, the meeting I’ll be watching closely is the first meeting of the new Fed Chair (TBD), which is in July 2026, shown below.
Is Only 1 Rate Cut By July Bullish?
It’s noteworthy that the chart above suggests a 40% chance that the Fed Funds rate will be at 3.5% and about a 28% chance that it will be at 3.25%. Assuming Powell cuts to 3.75% next week, this implies only 1, maybe 2 more cuts in the next 6 months.
This doesn’t sound bullish for a market that has been so correlated with rates on path lower. However, there are a few paths that lead to higher equities from here.
First, if the market is correctly anticipating that the economy will get stronger, that could push stocks higher without lower rates.
Second, if the narrative around the economy becomes one of a ‘soft landing’, the current probabilities have plenty of room to increase, and stocks will likely see that as bullish as they have in 2025.
Comparing AAPLs to ORCLs
The Fed isn’t the only game in town this week. The market will also be focused on Oracle’s earnings report, due Wednesday.
It was ORCL's last earnings report that shocked the market with its extraordinary outlook for revenue growth based on its exploding backlog and partnership with OpenAI.
ORCL has also earned the reputation of being the “canary in the coal mine” with respect to the market’s fear that the data center buildout has shifted from affordable to fiscally reclass by some on Wall Street.
In our Nov. 16th Market Outlook, we reported that ORCL’s 40-year bonds were a strong leading indicator of market confidence in its stock price. Additionally, ORCL’s CDS prices skyrocketed, which is an even more sophisticated and sensitive measure of the market's confidence in a company's balance sheet.
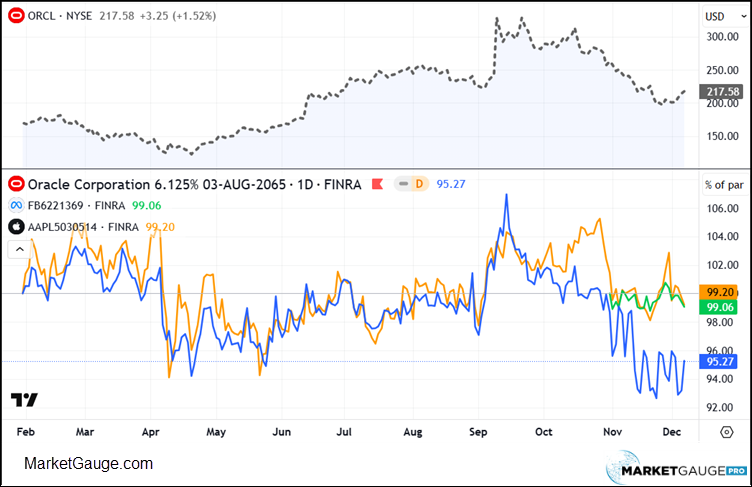
Here’s an updated perspective. In the chart below, you’ll find the stock price along with the long bonds of ORCL, AAPL, and MSFT for perspective.
While the news reports ORCL’s earnings, savvy investors will be watching their bonds.
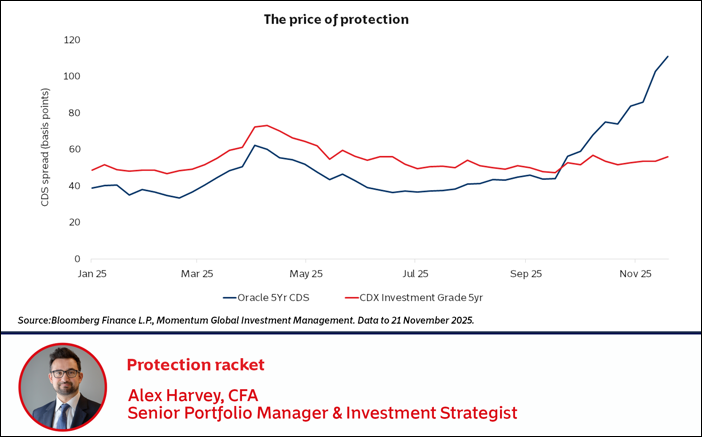
In the chart below, the blue line shows the five-year credit default swap (CDS) for Oracle Corp. A CDS is an over-the-counter derivative that lets investors bet on a company’s credit risk. Oracle’s current CDS spread is 110 basis points, meaning it costs $110,000 per year to insure $10 million of its debt. The orange line shows the 5-year CDX IG index—an average of 125 liquid U.S. investment-grade issuers.
The pattern in the CDS chart that has represented the bearish implication for the AI data center build out is that ORCL was viewed as a better than market risk (blue line under the red), until its rapid repricing, which began in September.
Got Santa Rally FOMO? Be patient.
Fortunately, the Fed and Oracle will both have their chance to rattle the markets before the Santa Claus rally typically shows up.
As it turns out, Santa tends to show up on Wall Street after a particular trading day and it favors the S&P 500 over the Nasdaq.
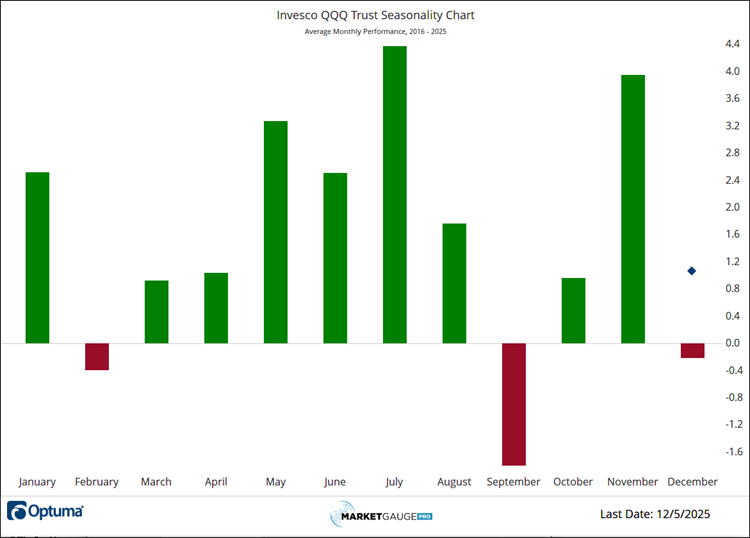
The charts below (also found in the Seasonality section of Big View) show that the last 25 years have not been as merry as you might have believed in December.
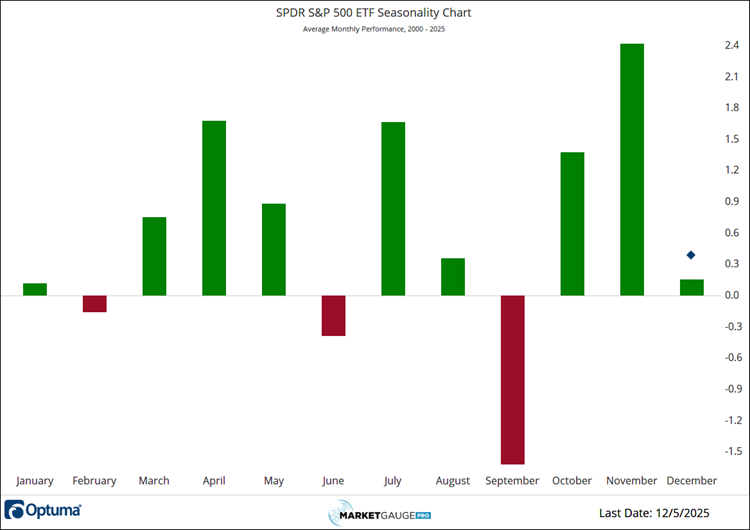
Additionally, if you want your odds of being profitable to be positive, you’re better off in the SPY than the QQQ.
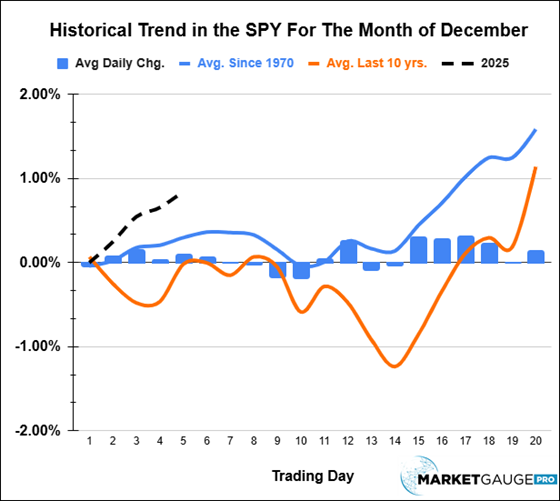
When you dig into the pattern within the month of December there are some helpful dates.
The chart below that displays the trading days of the month shows that the month tends to be positive for about the first 7 trading days, weak for the next 7 trading days, and then Santa shows up on the 15th trading day of the month. This year, the 15th trading day will be Friday the 19th. That Friday is also when we’ll get one of the Fed’s favorite inflation measures – PCE.
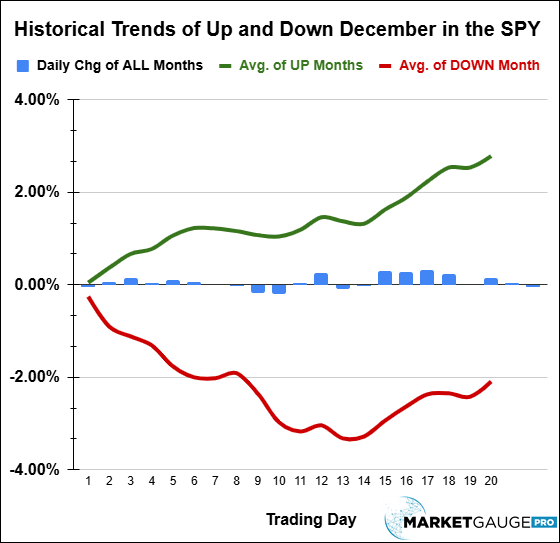
It doesn’t matter whether the year is experiencing an up or down December; in both scenarios, the Santa rally statistically begins on the same day.
Below, we look at December split into two cohorts: months that ended with positive monthly returns and those that ended with negative monthly returns. The pattern of the strong uptrend in the last 7 days of the month is the same in both cases.
Is November’s Leadership Driving December?
November saw some big rotation and big moves in sectors and themes.
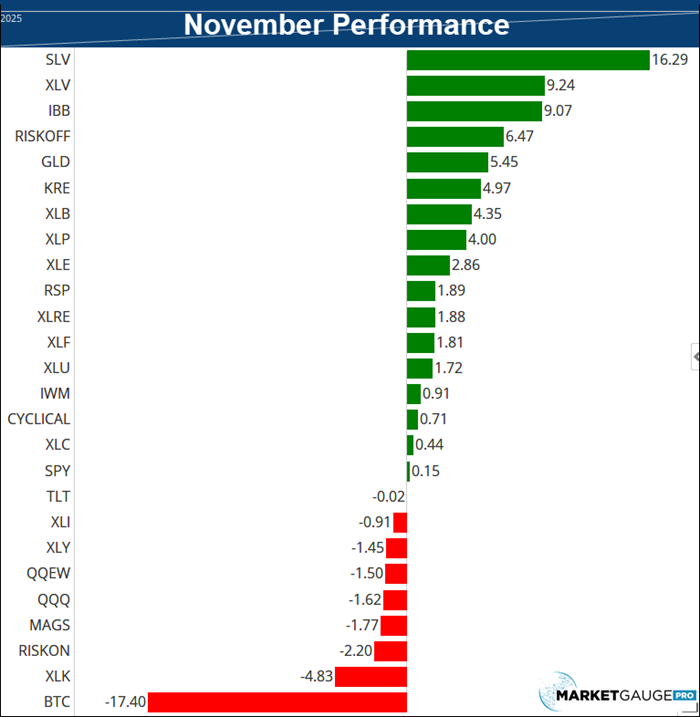
Silver (SLV) has continued to shine in December, but as you can see below, there has been a substantial rotation in December.
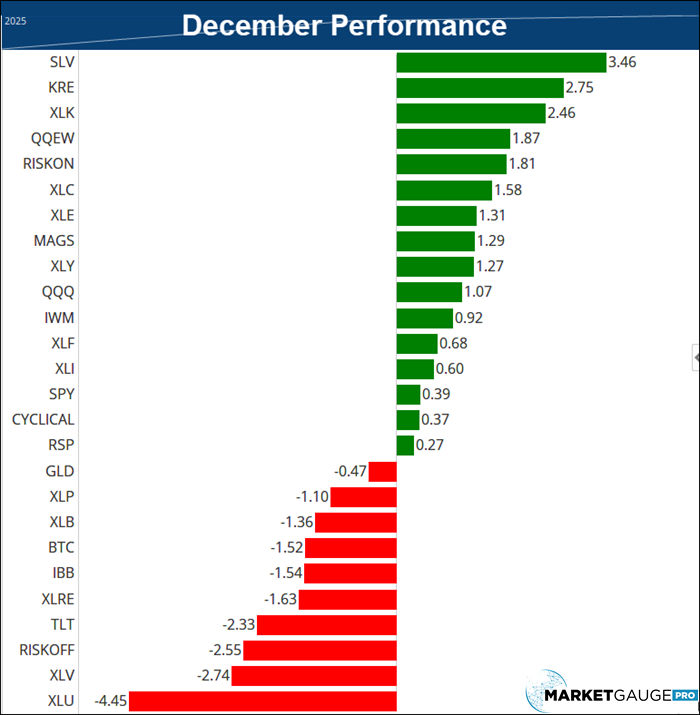
November followed MarketGauge’s monthly calendar range pattern closely by never trading higher than the first day of the month. December, thus far, is following the pattern of an up month based on the Monthly Calendar Range template and the seasonal pattern shown above.
In January, we always assume the new year could bring new trends, but for December the market’s message is stick with what’s working.
If you'd like help taking advantage of the Santa Claus rally or getting the most out of 2026, contact us.
Best wishes for your trading,
Geoff Bysshe
 |
 Every week we review the big picture of the market's technical condition as seen through the lens of our Big View data charts. Every week we review the big picture of the market's technical condition as seen through the lens of our Big View data charts.
The bullets provide a quick summary organized by conditions we see as being risk-on, risk-off, or neutral. The video analysis dives deeper. |
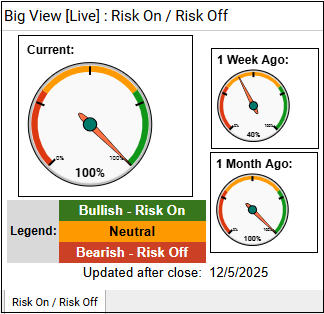
Summary: The market leaned solidly risk-on this week, with major indexes, sectors, internals, and the Risk Gauge all strengthening while volatility fell to its lowest levels since September. A few pockets of caution remain—such as rising rates, seasonal tax-selling pressure, and waning momentum in gold and Bitcoin—but overall conditions continue to favor bullish positioning.
Risk On
Neutral
Risk Off
**There will not be a video this week.

Every week you'll gain actionable insight with:


