Sentiment Sinks Stocks

November has a very different tone to it than every other month has had since the April low.
An easy way to see this is shown in the chart below, which has lines that mark the high and low of the first day of the month.
Our discretionary trading members know this indicator as the Monthly Opening Range, and it can be very insightful when used correctly.
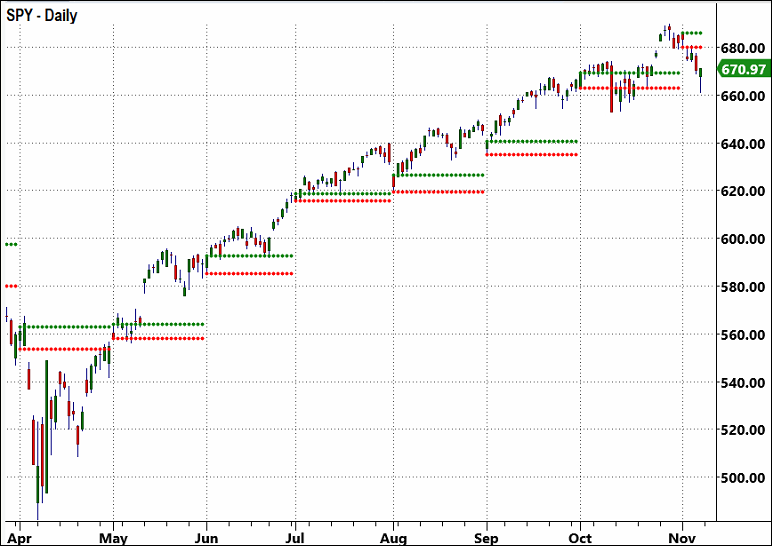
There have been plenty of reasons for stocks to fall for months, November is seasonally the strongest month of the year, and earnings season has been very strong.
So why is the market falling?
There wasn’t one primary catalyst, but last week’s decline in stocks can be explained with one simple reason.
Let’s take a look at the data.
**This week's market commentary will be published tonight, but don't wait to review the Big View Bullets, Actionable Ideas, and Keith's Market Analysis below now
The commentary will cover:
- Earnings season results
- A different look at the bearish Challenger job market report
- What to do with the November price action
- The seasonal trends that may shed insight into want to expect this November
 |
 Every week we review the big picture of the market's technical condition as seen through the lens of our Big View data charts. Every week we review the big picture of the market's technical condition as seen through the lens of our Big View data charts.
The bullets provide a quick summary organized by conditions we see as being risk-on, risk-off, or neutral.
The video analysis dives deeper. |
Market Summary
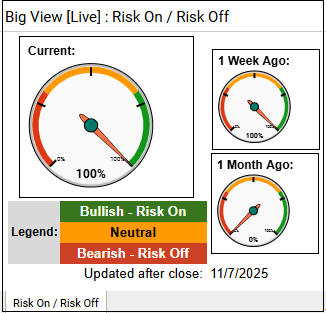
Markets pulled back but stabilized by week’s end, with major indexes rebounding off key moving averages and the overall risk gauge staying fully risk-on as value, transports, and foreign equities regained strength. However, persistent weakness in technology and semiconductors, along with two recent Hindenburg signals and negative market internals, highlight lingering risk-off undertones despite supportive seasonality in November.
Risk On
- Foreign equities, from Asia to Latin America, held up nicely in the five-day biggest gainers and losers. (+)
- Risk gauge remains fully risk-on. (+)
- Value recovered its bull phase with Growth still closing in a bull phase by week's end. (+)
- For the most part, the Economic Modern Family improved by Friday's close, with transports regaining its bull phase, retail bouncing off the 200 Day Moving Average as did regional banks. (+)
- Foreign equities held up better overall than domestic markets with both emerging and developing markets remaining in a bullish phase. (+)
- Seasonally, November is the strongest month and tends to trend positive throughout, though we are off to a slow start. (+)
Neutral
- Markets closed down between -1.3% and -3.1% on the week across the major indexes with three of the indexes testing their 50-Day Moving Average and successfully closing above with a bullish hammer formation it by the end of the day Friday. IWM closed in a weak warning phase. (=)
- Volume patterns moved from risk-on to neutral. (=)
- Market internals improved back to a neutral reading this week with the McClellan Oscillator improving to a just slightly negative for the S&P. (=).
- Aggs and copper remain stuck in the middle of their trading ranges. (=)
- Gold is still digesting its 10% sell-off from its recent parabolic move while Oil is also stuck in its wide trading range for the last four years. (=)
- Bitcoin tested the $100k level for the first time in several months and closed right on its 200-Day Moving average with momentum suggesting positive mean reversion. Neutral until we get move confirmation above the 200-Day Moving Average. (=)
- Rates are in weak warning phases and still in wider trading ranges, a neutral overall for markets. (=)
Risk Off
- Sectors were mixed with a deeper skew negative, especially in risk-on sectors like Technology and Semiconductors, both down over -4%. However, financials held. A slight risk-off bias overall. (-)
- Market internals for the NASDAQ Composite showing a more definite risk-off reading. (-)
- The new high new low indicator is showing strong risk-off signals and two recent hindenburg indications for both the SPY and the NASDQ100. (-)
- The color charts (moving average of stocks above key moving averages) are giving negative intermediate readings. (-)
- Volatility remained in a recovery phase, though it sold off on Friday’s positive market close. The cash VIX closed under the 200-Day Moving Average. However sentiment remains Risk-off unless it can close under the 50-Day Moving Average. (-)
Actionable Trading Plan
- Equity Positioning:
Maintain a moderately risk-on stance, with core exposure in value, transports, and foreign equities (especially emerging markets), which are showing relative strength and renewed bull phases. Favor rotation into areas holding above the 50-day moving average with confirmed hammer reversals (SPY, DIA, EFA, EEM), while limiting exposure to technology and semiconductors until they stabilize above short-term resistance.
- Tactical Entries & Exits:
Look to add exposure on pullbacks to 20- or 50-day moving averages in leaders like value ETFs (VLUE, IWD) and transports (IYT) with stops 2–3% below recent lows.
- Risk & Confirmation Signals:
Watch for confirmation from the Hindenburg Omen and new high/new low ratios—sustained negative readings would justify hedging (via SH, PSQ, or short-term puts). Conversely, if the VIX stays below its 200-DMA and the risk gauge holds 100%, add to equities incrementally through mid-month.
- Commodities & Crypto:
Keep gold and oil neutral within their trading ranges—no new positions until breakouts occur. Bitcoin may offer a tactical long opportunity above $100k and its 200-DMA, targeting $115–120k with stops near $94k.
- Rates & Macro Overlay:
With yields stabilizing in neutral phases, maintain balanced duration exposure—short-to-intermediate bonds (3–7 years) are preferred over long duration. Stay alert for any surge in volatility or breadth deterioration as a cue to reduce equity beta quickly.
Stay One Step Ahead of The Markets and Profit
From The Current Volatility With Market Outlook


