October 12, 2025
Weekly Market Outlook
By Geoff Bysshe

If this is another TACO tariff power play, it’s a particularly spicy one.
On the surface, Friday’s market selloff could be attributed to another 100% tariff threat.
Or it could be a result of the market finally finding the straw that breaks the bulls’ back as the market focuses on data like the chart below, which does NOT factor in Friday’s new 100% increases on Chinese imports:
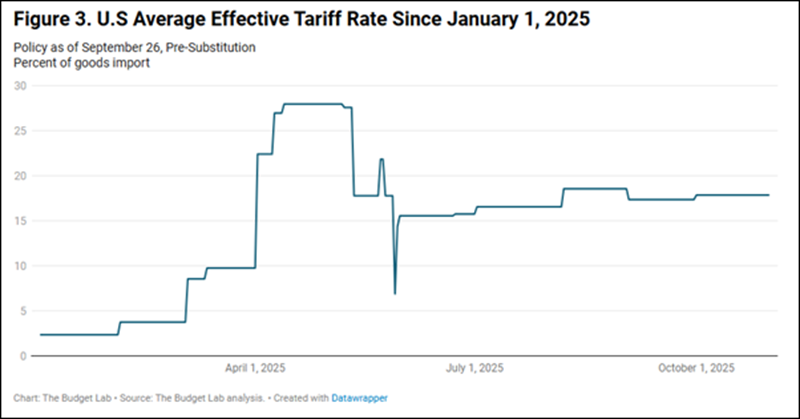
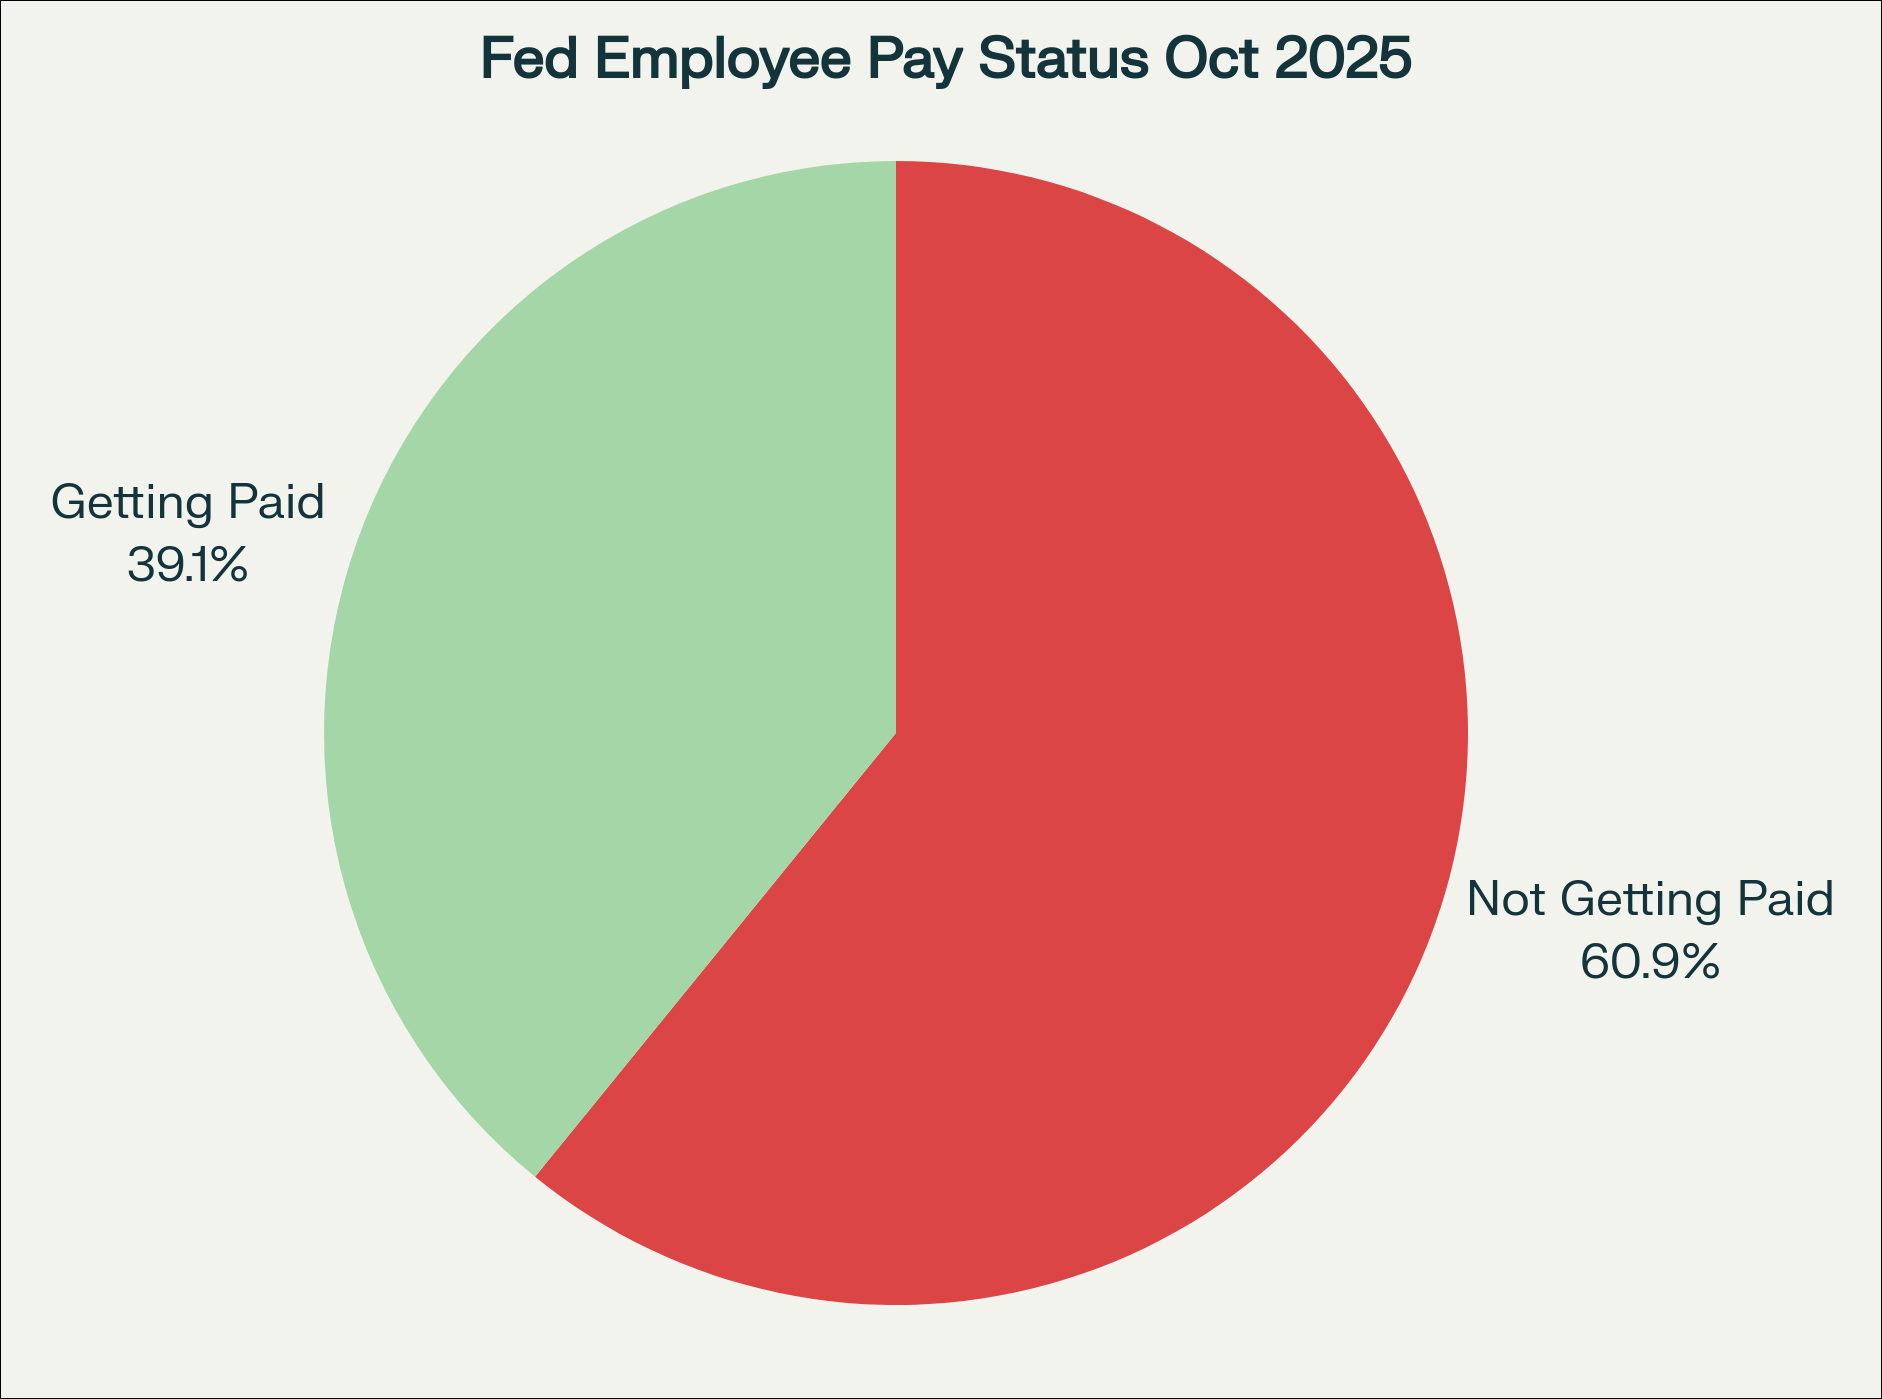
Approximately 60% of government employees are not receiving their pay as a result of the shutdown.
Members of Congress, however, continue to receive pay, and their compensation is substantially higher than that of the average federal employee.
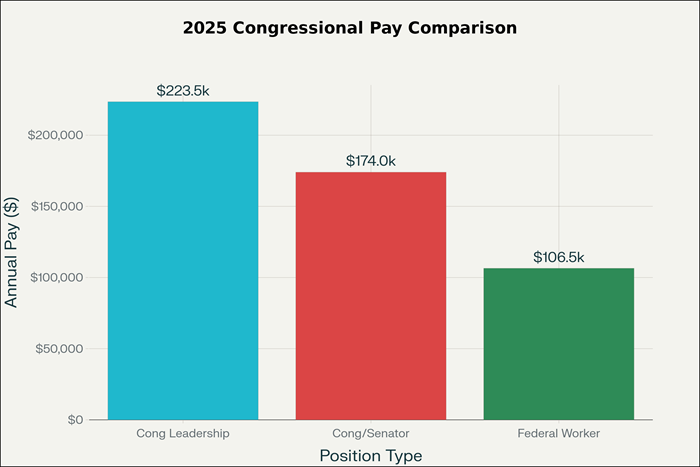
That doesn’t seem right. It can’t be good for morale, and this at a time when the government is going to need to respond to Trump’s desire to push the trade war to a new level. These are not the same conditions the market priced in as it collapsed in April.
What has become very clear over the last several months (or longer) is that the biggest risks of an escalation of the trade war with China aren’t inflation or supply chain disruption.
It’s much bigger, and the market has most certainly not priced in this risk.
Investors, knowingly or not, are betting that the trade war with China will get resolved. I, too, believe it will be resolved without dire consequences to the U.S. and global economic output, and a potential major blow to the US military’s technological resources, and more.
However, it’s essential to recognize the broader risk at play following Friday’s trade war escalation, so we can monitor the market for signs that reveal the market’s level of concern regarding this risk.
The road to any resolution, certainly, is not clear, and the market will most likely price it in before it is.
The Bigger Risk That Isn’t Priced In.
It’s too early to tell if the market is focused on this, but Friday’s market action may suggest it’s coming.
It’s one thing to adapt to higher prices; it’s another to lose access to the materials that are critical to your country's economic growth and military advantage.
The market has priced in the former; the latter is not.
Is The Market Wrong?
The bulls in the market see the world at the early stages of a technological transformation that has been described as being as significant as the invention of electricity, and many times more significant than the development of the internet.
The bears view AI as overhyped or a long way from being life-changing.
The analogy from the 1990s might sound like this…
The bears point to the development of the internet and describe the .dot com crash. The bulls see the birth of Apple’s smartphone, AMZN’s e-commerce, AWS cloud computing, and the like.
They’re both right.
The good news is there’s another tech bubble underway; the bad news is it will pop. They all do.
If you’re so inclined, choose your side, bull or bear, with respect to the current bull market. Then put that thought to the side.
In this week’s Market Outlook, as we consider Friday’s market selloff, I want to suggest that we don’t focus on whether the bull market is a bubble about to burst or just getting started.
Instead, consider why the market may have had an unusually bad day, and how we can apply lessons from the tariff tantrum earlier this year to the current market.
The last 6 months have demonstrated that:
The result has been a relatively low volatility bull market run of over 30% from the lows in April.
Did the Market Change Its Belief About Tariffs,
or Did Something Else Change?
Friday’s market decline was the biggest daily decline since April, and more unusual is its 2.8% decline within one day of an all-time high.
That represents an abrupt change in market sentiment.
Several weeks ago, in the September 21st Market Outlook, “The Investor’s Paradox of Uncertainty…”, I discussed the relationship between the size of down moves and their location relative to the market’s 52-week high.
Markets don’t typically fall this hard from the 52-week high. They tend to be more resilient until some form of a downtrend has developed.
In the moment, the rationale for the steady selling in the S&P 500, feeble intra-day rallies, and a broad market participation could have been the fact that 100% tariff threats before a weekend was no time to increase risk and a good time to book profits.
Additionally, the bond market will be closed on Monday for Columbus Day, so if institutions wanted to move out of stocks and into bonds, Friday was the day.
As Keith points out in this week’s video and as we’ve been watching in our daily live in market mentoring sessions, the VIX (a gauge of investors’ fear) has been in a steady state of decline or consolidation since May, but that changed abruptly on Friday.
The change in the VIX didn’t grow higher as the day progressed. It rocketed to its highest levels since May, immediately on the tariff news.
The exaggerated reaction could be attributed to the fact that trade with China is bigger than any other trading partner, and the exchange of technology between our countries is incredibly significant.
We’ve been there before.
Additionally, the expectation was that Trump would be meeting President Xi in a couple of weeks to work on trade issues.
So, a sudden escalation of tariffs to 100% and applied more broadly is akin to a “Liberation Day” shock, but remember, markets have adapted to the hyperbolic threats.
Friday’s market action suggested something more than a hyperbolic tariff threat.
What Changed?
Tariffs on Chinese goods aren’t the market’s biggest concern. The risk of the trade war leading to China's refusal to export critical rare earth minerals, such as dysprosium and samarium.
These are two examples of minerals that are critical in the manufacturing of semiconductors and used in important technologies like EV cars and military equipment, including the new F-35 fighter jets.
The threat isn’t limited to raising prices, China produces 99% of the world’s samarium (used in the F-35).
According to the NY Times…
“China refines 99 percent of the world’s dysprosium, a kind of rare earth that is used in chips to preserve magnetic stability even when they become hot.
In the last few years, Nvidia and other semiconductor manufacturers have changed the material used in electricity management devices, called capacitors, on chips to make them more heat-resistant. The capacitors are made from ultrapure dysprosium, which is extremely difficult to refine. A single refinery in Wuxi, near Shanghai, produces the entire world’s supply of ultrapure dysprosium.”
In Trump’s announcement of the new tariffs in a Truth Social post on Friday, he justified his actions as a response to China’s export restrictions, which he described as “extraordinarily aggressive” and a “moral disgrace,” emphasizing their impact on global trade and calling the move “sinister and hostile”.
It's not often that I get to say that I think Trump’s words are “putting the severity of the situation lightly.”
The markets have not priced in the potentially extraordinary outcomes, and nor should they at this point.
What To Do Next
The Chinese have plenty of reasons to continue to provide the US access to the rare earth minerals that they monopolize, but the fact that they have demonstrated a willingness to use this leverage so publicly shifts the situation that the market needs to price into something much more threatening to the economic growth that ultimately supports the stock market.
As we enter earnings season, it is normal for earnings news to dominate market action. However, if it appears that “tariffs” are driving the markets, be sure to look beyond the headlines.
The risk of a significant market downside is now a potential market driver if there is an escalation in confrontations over rare earth minerals.
The bearish case is obvious; the bullish case, on the other hand, is that this threat and leverage are not new. If this escalation of attention leads to a resolution and greater certainty for companies that need access to these minerals, the bullish case for accelerating the AI transformation will be further strengthened.
In the tariff tantrum at the beginning of the year, the collapsing market had an unusual situation in that one person could say, “I changed my mind,” and the market would reverse. That’s what happened.
If the current situation gets similarly bearish, the bulls will argue that there’s a repeating historical pattern. The problem is that one man who would reverse it most quickly doesn’t live in America.
As a result, this situation is ripe for a market overreaction, but if you believe in America’s companies, military, and leaders' ability to adapt in the face of big challenges, don’t lose sight of the silver lining.
If the bears are right in the short term, the bulls will later thank them for the opportunity to buy tomorrow’s great stocks at lower prices today.
If you want to stay on top of or ahead of potentially serious market volatility, keep your eyes on the market’s reaction to the political games being played with respect to rare earth minerals.
If you'd like help taking advantage for market volatility, contact us.
Best wishes for your trading,
Geoff Bysshe
 |
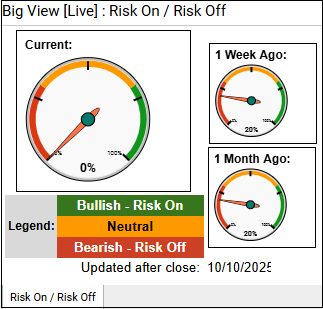 Every week we review the big picture of the market's technical condition as seen through the lens of our Big View data charts. Every week we review the big picture of the market's technical condition as seen through the lens of our Big View data charts.
The bullets provide a quick summary organized by conditions we see as being risk-on, risk-off, or neutral. The video analysis dives deeper. |
Market Summary
Markets shifted sharply to a risk-off stance this week, with major U.S. indices breaking technical support, momentum fading, sector breadth weakening, and volatility spiking — all while safe havens like Gold and Treasuries gained. The deterioration in key indicators, including the Economic Modern Family, volume, and internals, suggests rising recession risk and heightened caution despite longer-term charts still holding up.
Risk Off
Risk On
Risk-Off Trading Plan – October 2025
🔒 1. Defensive Positioning (Capital Preservation First)
🛡️ 2. Hedge or Short Weakness
💡 3. Rotate into Safe-Haven Assets
🔄 5. Reassessment Triggers
Re-evaluate this plan if:
📌 Quick Summary:
Cut weak longs, hedge risk, rotate defensively, and watch Gold and Treasuries for leadership. Be ready to pivot if breadth improves and key support levels are reclaimed.

Every week you'll gain actionable insight with:


