December 17, 2023
Weekly Market Outlook
By Keith Schneider

Welcome Gaugers, friends and interested readers. Happy you joined us.
By now, you are well aware that on Wednesday Jerome Powell and the Fed became “dovish” and pivoted to a STOP on interest rate hikes. More importantly, the Fed Chairman stated that the Committee could see as many as three rate cuts in 2024. Most analysts had suggested (or predicted) that we would see only two rate cuts next year, but Jerome Powell gave an indication that we could see as many as three 25 basis point reductions in the Fed Fund rate during 2024. The markets reacted favorably, and the party (which may have begun in early November) kicked into high gear.
For the week, the major markets were up between 2.5% (S&P 500) to 2.9% (QQQ). Small-cap stocks (IWM), which had been trending sideways for most of the year (due to higher borrowing costs, which affect smaller companies more than the big cash rich companies), rallied 5.8% and now puts the Russell 2000 Small-cap index in double digit returns for 2023.
The Dow and the NASDAQ 100 (QQQ) both made new all-time highs and have been positive on a 7 week winning streak. You may want to go back and reread our Market Outlooks from the last 7 weeks and the various indicators that had been forecasting a bullish move up in the markets, including our own Profit Navigator which got fully invested in the SPY ETF in late October. (Profit Navigator took two profit targets this week locking the gains from late October).
The bull market of 2023 continues.

We provide a few charts illustrating the new all-time returns of the DOW and the QQQ. See below:


The S&P 500 is also a whisker away from hitting a new all-time high. In bull markets old highs act as magnets and attract the indices to them as do whole numbers like 4800. We are optimistic that the S&P 500 will soon pierce its old number. More on that to follow. See chart below:

Not only is the S&P about to post new highs, but surprisingly it is now 8% higher than when the Federal Reserve began its hawkish hiking campaign. See chart below:

Small-Cap Stocks.
While the Russell 2000 small-cap index (IWM) is nowhere near its all-time high, it did make a new 52-week high and has picked up momentum that may help provide a tailwind for this market capitalization segment of the market. Many of these companies depend on financing and carry a higher % of debt on their balance sheets especially as their businesses are growing rapidly. So, the fact that interest rates have come down markedly implies that smaller companies may feel the financial loosening benefits more quickly. See IWM chart below:


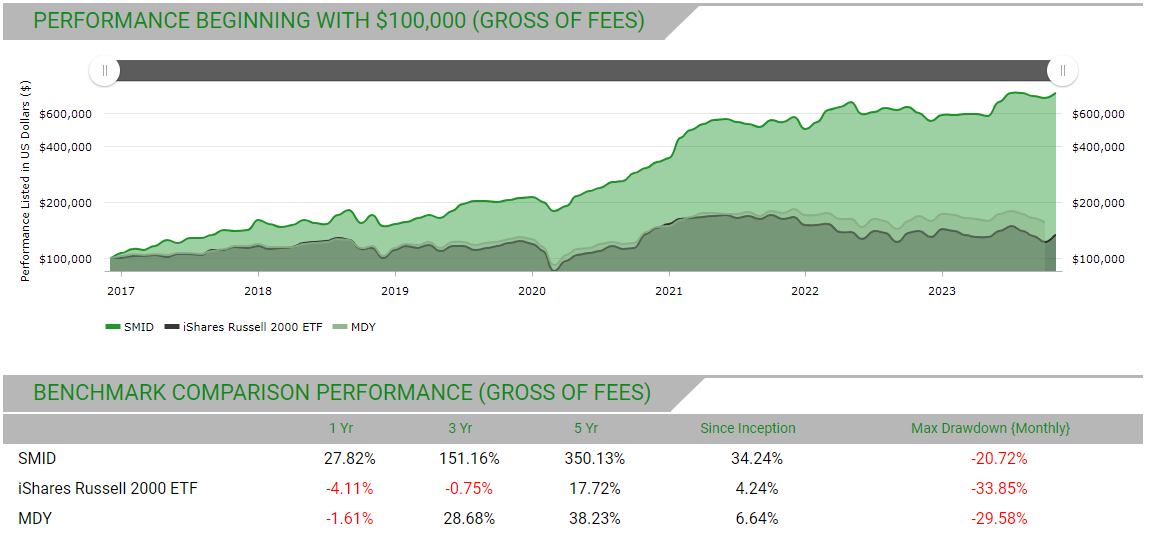
Please note: MarketGauge has a small-midcap earnings based strategy that, if followed this year, has produced a return of more than 45% for 2023. This (real + back tested results) model has produced a better than 34% return (without fees) per year for almost 7 years since its inception. Also, the IWM and MDY (Midcap index) are both negative for 12 months while this strategy is up over 27%. We show a growth of $100,000 chart below ($100,000 was up over 5x in 7 years) If you would like more information reach out to Rob Quinn at [email protected].
From these various charts, it is important to stay aware that the indices (SPY, DIA, QQQ and IWM) are comprised of a large number of stocks. While these are all cap weighted indices, the equal weighted S&P 500 (RSP) and the QQQ (QQEW) have both begun to rally impressively. Meaning= many of the average stocks are breaking out. This explains why the indices are hitting new all-time or 52-week highs.

See additional charts below:

You will note above that the 50-day (blue) moving average may soon go through the 200-day (red) moving average, which is called a positive Golden Cross. Also, it is not lost on us that the RSI (Relative Strength Indicator) is well above the 70 number, which typically marks the beginning of an overbought move. While this can go on for a lengthy period, a reversion to the mean typically takes place at some point when investors capture gains. However, in this case, it may not occur until after the beginning of the year, and we welcome a new tax period for capital gains.
Below, you can see that the 93 lower capitalization stocks (ex-magnificent 7) have perked up and are beginning to look more positive. See chart below:

2023 has rewarded high growth stocks. These cash-rich companies have been the biggest beneficiaries from earnings growth and the lower volatility/high beta stocks have mostly gone sideways. As shown above through the RSP and the QQEW these stocks have now joined the party. See chart below:

Speculation through new Initial Public Offerings (IPOs) is also seeing a major rebound recently. See chart below:

The Fuel That Created This Push Higher.
The Fed poured fuel on the fire that had started in late October when inflation numbers came out below expectations and interest rates backed off. When the Fed on Wednesday indicated that interest rates could come down over the next year, this was additional rocket fuel for the stock market party.
According to the Fed’s new posture, which began last Wednesday, they are starting to see many economic indicators showing a weakening economy. These include a recent slowdown in job creation, struggling consumers, a record amount of credit debt, a screeching halt to mortgage demand and new home purchases, and other weak forecasts, all a direct result of their hawkish stance and numerous interest rate hikes these past two years. Couple that with recent downward moves in oil and commodity prices, and a US Dollar declining sharply--all helped kick the stock market rally (party) into celebration mode this past week.
We have continued to provide many of these slowing economic charts over the past few months. Below, we find a few charts that show signs of a weakening economy:


Positive investment sentiment is also helping.
When investors are more positive about the future of the stock market and are contributing new inflows into their investment accounts, this is always the wind at the market’s back. This measurement always shows up in positive investment sentiment readings.
The recent readings on investor sentiment show individuals and institutions are rotating invested cash (having recently come down from 5% on the 10-year Treasury to 3.9% this week) into bonds and equities. These investors have pushed up the bullish-bearish sentiment readings to new highs in the bullish bias. See chart below:

The Fear-Greed chart (published by CNN) below is that investors now sit firmly in GREED. We have shown this chart many times before. Our friend (and future contributing writer to MarketGauge Pro) Jeff Huge at Alpha Insights (www.jwhinvestment.com) shares his insights (below) that we are getting closer to extremes that would portend a trend reversal. (more on this caution later).

Past history provides evidence that this positive stock market momentum can continue.
The stock market is forward looking.
The Federal Reserve has quickly pivoted and proclaimed that they could see several reductions in the Fed Funds rate going forward. The risk markets, including but not limited to the above charts and market indices as well as the fixed income markets, including other lower grade credit investments (high yield bonds) have already priced in that there will be more than 3 rate cuts next year and will begin as early as March of 2024.
We are not so sure. Inflation remains elevated and may surprise to the upside in future months.
Yet there is plenty of evidence that this period (stock market party) can continue into the New Year. We remind you that we are in an attractive seasonal period for stocks. Plus, the Santa Claus rally typically doesn’t start until after Christmas. See charts below:


Does the Federal Reserve know something we don’t? Why we still recommend CAUTION.
The Fed pivoted very quickly. How fast?
As recently as November 1 the Fed stated: “Getting inflation to 2% has a long way to go”. And then again on November 21 when they said “No indication of rate cuts at last meeting” to December 1st stating “Talking about rate cuts are premature”. Then on December 13 stating that “Rates have peaked and 3 rate cuts are coming in 2024?”.
They must know something that is coming. Personally, I remain of the opinion that residential and commercial real estate is in serious trouble and may be in for ongoing problems. Many owners of commercial buildings have not been able to conduct profitable businesses with the higher interest rates and have turned the buildings over to the lenders in lieu of foreclosure.
It was these and other potential problem areas among US businesses that also gave the Federal Reserve the ammunition to STOP raising rates. We are just not so sure that interest rate cuts are as close at hand unless the economy really spirals out of control or that we enter a recession. One important note that virtually few analysts have mentioned since their meeting last Wednesday, is that the Fed stated that they were continuing with their campaign of quantitative tightening (reducing their balance sheet and selling their bonds).
Reading between the lines of the Fed’s messaging, we believe it is wise to remain cautious. (one secret to our winning investment formula is that our strategies all utilize risk management, which automatically gets defensive when required by the Quant models)
Here are a few other signs that provide additional caution to not get too aggressive:
Please know that like you, we are enjoying the positive markets and are participating fully. Like you, we want this to continue throughout the coming year. However, we are realists.
We are a company that puts RISK-MANAGEMENT FIRST. Whether in our investment models, All-Weather Portfolio Blends that we manage for others or through our education and trading insights, controlling the downside and maintaining risk aversion is key.
If and when you reach out to [email protected] or if you want more information on our asset management services, reach out to [email protected], ask them both about the recent profit targets we have taken in our investment strategies and WHY locking in profits is SO IMPORTANT to our overall methodology (as well as instituting STOPS).
Thanks for reading. Have a good pre-Christmas week. Good luck in your investing and trading. Now we turn it over to Keith and his team in Big View.

Risk On
Risk Neutral
Risk Off

Every week you'll gain actionable insight with:


