September 21, 2025
Weekly Market Outlook
By Geoff Bysshe
Investing is filled with paradoxes that can confuse or harm investors’ understanding of markets and hold back their ability to generate great returns with stocks.
As the market hits new highs, this paradox keeps “cautious” investors sitting on the sidelines…
“The market hates uncertainty; however, strong bull markets climb a wall of worry.”
When markets sell off, investors find a false sense of comfort in this paradox…
“It’s time in the market that matters most, so you don’t miss the biggest up days; however, most of the biggest up days happen after big market declines.”
Avoiding uncertainty and being in the market for the biggest up days sound like a good ideas, but the market isn’t always that intuitive.
Wall Street’s clichés are helpful when you put them in the proper context and don’t let them distract you from the first principles of stock market behavior such as:
It’s true that markets hate uncertainty—but not always for the reasons you think. In fact, sometimes markets rise because of uncertainty.
In the right context, uncertainty becomes a fog that hides opportunity. That’s why bull markets climb a wall of worry.
When uncertainty is high, it blinds investors to what’s really driving the market. If fundamentals are improving behind the fog, the market rises as the fog begins to lift. If fundamentals are deteriorating, the market falls further.
One of the most revealing questions an investor can ask:
"Looking out over the next 6 to 12 months, are conditions for corporate earnings growth improving? And is the market reflecting that answer?"
If both answers are yes, odds are the market will go higher.
The answer to the first part is rarely about one single factor. But investors and the media crave simple stories. So they focus on one theme and often ignore this first principle:
"Are earnings growth prospects getting better or worse over the next 6 to 12 months?"
News and events create short-term swings in sentiment and uncertainty. But the big moves in markets are grounded in the expectations for earnings and economic growth, looking 6 to 12 months ahead.
Bull markets advance as uncertainty is gradually replaced by positive reports of growing earnings and or improving economic conditions, leading to more investors becoming comfortable buying in.
Bear markets work in reverse. Fear deepens, sentiment turns, and more investors throw in the towel as earnings expectations deteriorate.
COVID shut down the economy, sparked a market crash, and stoked fears of a depression. The uncertainty was massive—and justified.
But in the fog of uncertainty, businesses pivoted fast: remote work, e-commerce, cloud tools, and new digital markets took off.
Fiscal stimulus and Fed liquidity helped bridge the economy back to growth.
Savvy investors recognized that conditions were going from bad to less bad—which, in investing, is often the turning point.
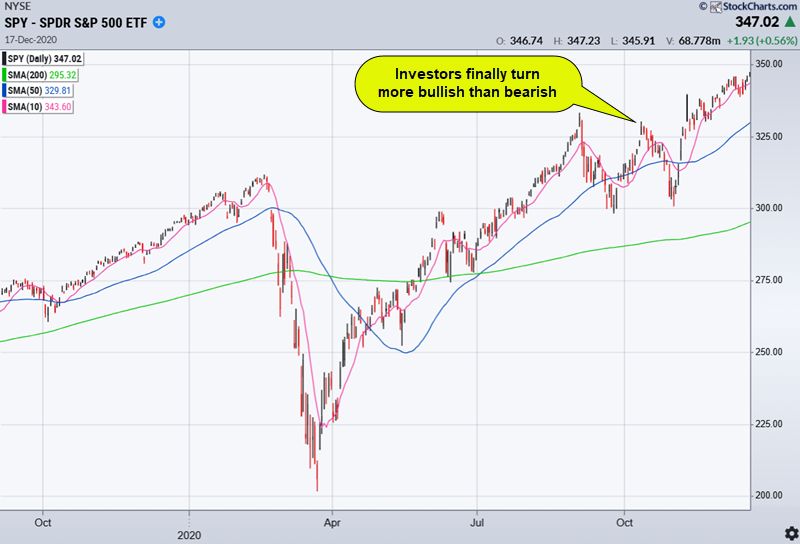
The market bottomed and rallied hard. Many investors waited to "feel safe" again. But by that time, the S&P 500 had already gained over 50% and surpassed pre-COVID highs.
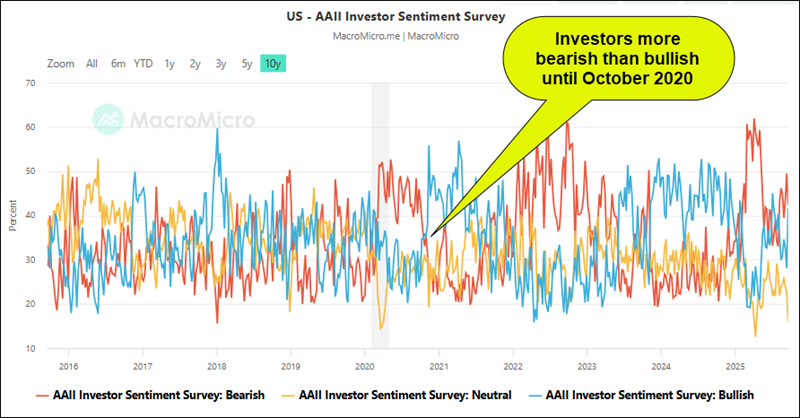
The charts below illustrate how the market perceived the companies adapting, but investor sentiment didn’t follow until it was too late. The fog of uncertainty hid the market’s expectations that the potential for higher profits was improving, as reflected by the charts.
Here's the chart of the S&P 500 in 2020.
In early 2025, new tariffs created real risks: 100%+ tariffs, inflation shocks, and economic drag.
The initial market reaction made sense. Profits were at risk. Uncertainty soared.
Then the President delayed the tariffs. Uncertainty lessened. That marked the peak uncertainty moment, savvy investors recognized the environment was getting "less bad," and the market rallied 3% in one day.
Companies adapted. Supply chains were rerouted, costs managed, and prices were raised strategically. Consequently, the impacts of tariffs were delayed and diminished.
Meanwhile, strong macro trends (AI, energy, tech) supported resilient earnings.
Result? A confusing but persistent bull market.
Despite headlines, earnings and profit expectations have held up and even improved.
As you can see in the charts below
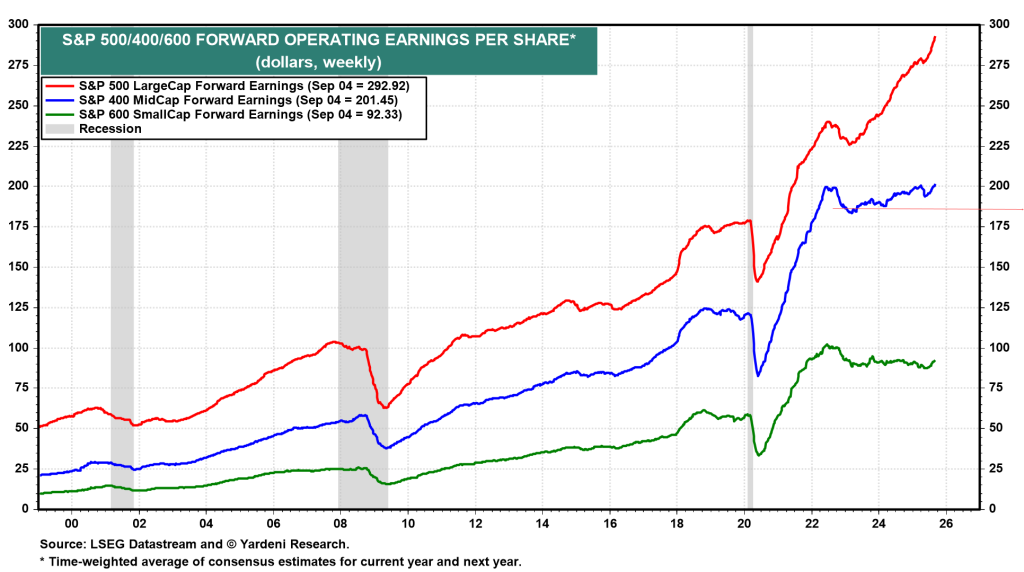
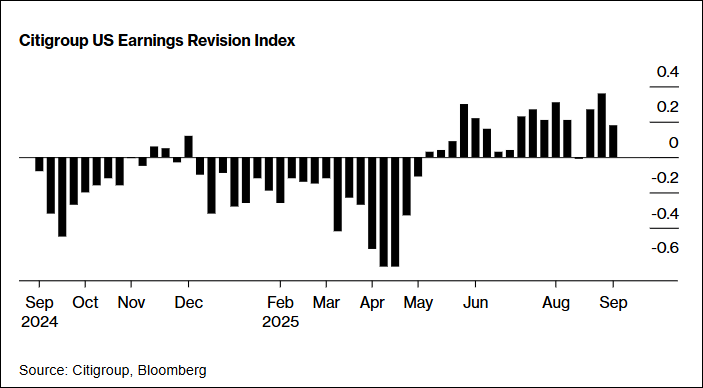
The bullishness isn’t just in the past. The chart below shows that the ratio of the number of earnings estimates being raised vs lowered is positive. Note that this data began getting “less bad” in April and has been positive since.
Despite this strength, investors remain bearish.
Commitment of Traders data shows speculators have almost 200,000 more short positions than long ones.
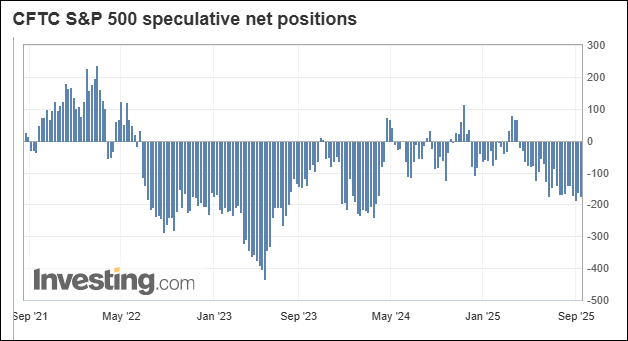
The chart above would suggest traders are bearish.
The chart below shows the same data with the details of the trend in long positions and short positions. I’m displaying a 3-month average of each data set to smooth it out the data.
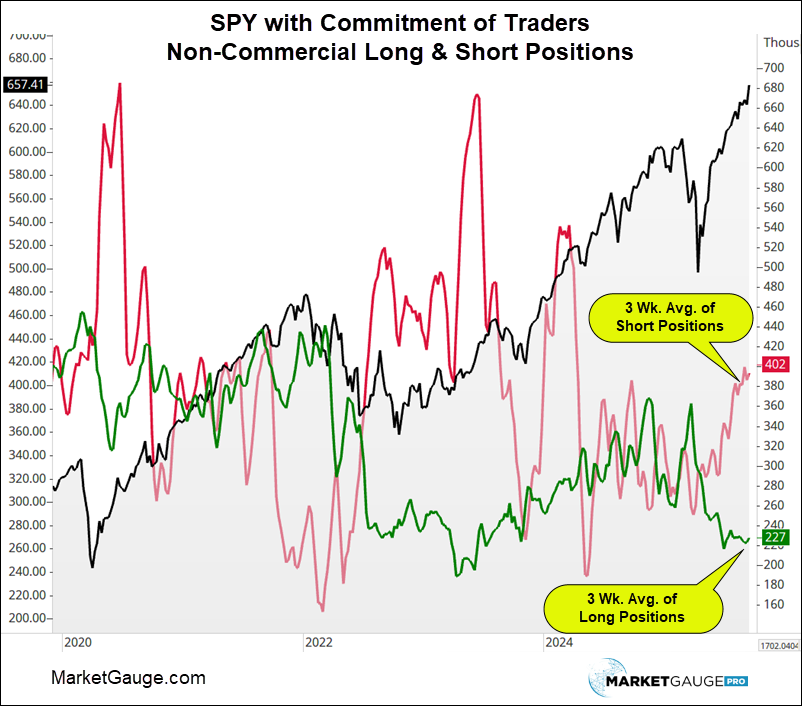
Since the tariff-induced bottom, traders have become more short, not less. That’s actually bullish:
Unless earnings expectations collapse, short-covering will help keep dips smaller and rallies stronger.
Good question. Here’s a surprising fact:
Another counter intuitive characteristic of the stock market is that the largest 1-day losses don’t occur near 52-week highs. The market is more volatile during corrections or bear markets than in bull markets.
The table and chart below show the same data in two different visualizations. The table shows the Top 21 single day declines since 1995 because that means it includes every decline bigger than -5.0%
The “Rank” is based on the size of the decline with 1 being the biggest.
| Rank | Date | 1-Day Loss |
% From 52-Wk High |
News (link to news source) |
|---|---|---|---|---|
| 1 | 3/16/2020 | -11.98% | -20.11% | Fed cuts to 0% and QE; fear surges to 1987-scale drop. (CBS News) |
| 2 | 3/12/2020 | -9.51% | -19.22% | Europe travel ban + pandemic panic; trading halts. (Nasdaq) |
| 3 | 10/15/2008 | -9.03% | -35.73% | Recession fears/weak data; biggest drop since 1987. (ABC) |
| 4 | 12/1/2008 | -8.93% | -41.18% | NBER says recession began Dec 2007; markets tumble. (NBER) |
| 5 | 9/29/2008 | -8.83% | -23.00% | House rejects $700B TARP bailout; historic plunge. (Reuters Screen Ocean) |
| 6 | 10/9/2008 | -7.62% | -37.51% | Global panic; Dow closes <9,000 despite rescue moves. (ABC News) |
| 7 | 3/9/2020 | -7.60% | -12.41% | Oil price war + COVID shock trigger circuit breaker. (PolitiFact) |
| 8 | 10/27/1997 | -6.84% | -4.25% | Asian crisis contagion sparks U.S. “mini-crash”; trading curbs hit. (SEC) |
| 9 | 8/31/1998 | -6.79% | -13.72% | Russia default/LTCM fears; tech leads a global rout. (WIRED) |
| 10 | 11/20/2008 | -6.71% | -47.06% | Fresh lows amid Citi collapse worries and deep slump. (Wikipedia) |
| 11 | 8/8/2011 | -6.66% | -12.49% | S&P downgrades U.S.; stocks tumble. (wbur) |
| 12 | 11/19/2008 | -6.12% | -43.61% | Citi fears; auto bailout stalls; Dow breaks 8,000. (Wikipedia) |
| 13 | 10/22/2008 | -6.10% | -38.49% | Disappointing earnings deepen recession worries. (MarketScreener) |
| 14 | 4/4/2025 | -5.97% | -12.22% | China retaliates to Trump tariffs; recession worries. (MarketBeat) |
| 15 | 6/11/2020 | -5.89% | -5.99% | Second-wave COVID fears after dour Fed outlook. (Forbes) |
| 16 | 4/14/2000 | -5.87% | -7.24% | Hot CPI fuels rate fears; dot-com unwind and margin calls. (WIRED) |
| 17 | 10/7/2008 | -5.74% | -32.94% | Credit freeze persists; Fed unveils CPFF amid stress. (Federal Reserve History) |
| 18 | 1/20/2009 | -5.28% | -40.97% | Inauguration Day: bank-sector crisis drags stocks. (Reuters Screen Ocean) |
| 19 | 11/5/2008 | -5.27% | -33.99% | Post-election selloff on recession angst. (ABC News) |
| 20 | 11/12/2008 | -5.19% | -41.00% | Paulson: TARP won’t buy “toxic assets”; stocks slide. (Forbes) |
| 21 | 3/18/2020 | -5.18% | -25.47% | Stimulus doubts; recession fears trigger another halt. (Nasdaq) |
| 22 | 11/6/2008 | -5.03% | -37.46% | Bleak retailer sales/outlooks; worst two-day slide since ’87. (Reuters Screen Ocean) |
The chart below shows the top 100 largest single day declines with the blue dots, and every date has a red dot indicating how far the market had corrected from its 52-week high before the 1-day drop.
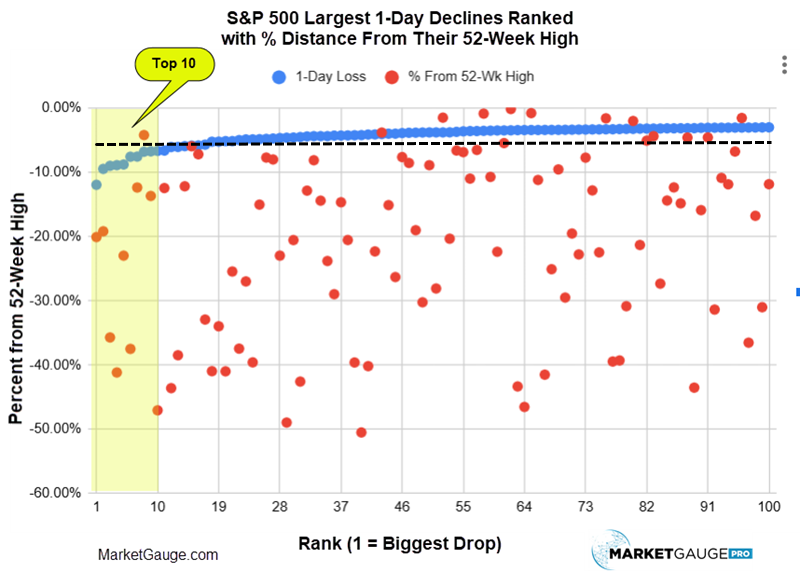
The dashed black line represents a 5% correction from the 52-week high.
Looking at the data since 1995:
If the market hasn’t already dropped 5% from its highs, a big (over 3% down day) is statistically quite rare
As an active investor, there’s a lot of “risk management you can do before the market is down 4%.
Tactical investing lets you avoid big drawdowns. But it requires discipline to re-enter when conditions improve.
It's often emotionally harder to buy than to sell.
Unlike buy-and-hold, you don’t rely on "time in the market" to save a bad entry. You need:
With that structure, uncertainty becomes opportunity.
If you follow Market Outlook, you know there are many ways to manage risk, avoid big drawdowns, and stay positioned for upside
Policy / The Fed
"Don’t fight the Fed." vs. "Markets climb a wall of worry—even during hikes."
Valuation
"Value wins long-term." vs. "Prices can stay irrational longer than you can stay solvent."
Trend vs. Reversion
"Trend is your friend." vs. "Everything reverts to the mean."
Timing
"Time in the market beats timing." vs. "Risk management is everything."
Buy the Dip
"Buy the dip." vs. "Don’t catch a falling knife."
Sentiment
"It’s a bull market." vs. "It’s overbought."
Diversification
"Diversify!" vs. "Concentrate to build wealth."
Size / Leadership
"Small caps lead." vs. "Mega caps dominate the index."
Rates & Stocks
"Higher rates hurt stocks." vs. "Rising rates = growth."
Seasonality
"Sell in May." vs. "Some of the best gains come in off-months."
We've written about many of these before. In every paradox, the truth lies in context.
The answer to which side is right?
It depends.
The best way to figure out what it depends on this time is to read the message of the market.
If today’s wall of worry is holding back your profits, let us help.
Best wishes for your trading,
Geoff
 |
 Every week we review the big picture of the market's technical condition as seen through the lens of our Big View data charts. Every week we review the big picture of the market's technical condition as seen through the lens of our Big View data charts.
The bullets provide a quick summary organized by conditions we see as being risk-on, risk-off, or neutral. The video analysis dives deeper. |
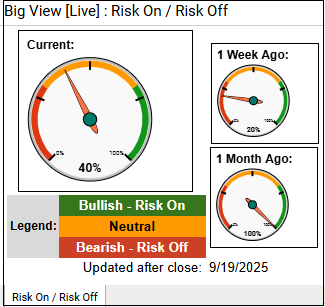
Summary: Markets surged to fresh all-time highs across all major indexes with strong sector performance, very low volatility, and broad strength in growth, value, and global equities, signaling a strong risk-on environment. However, internals such as volume, breadth, and new highs vs. lows remain mixed, the risk gauge has shifted to neutral, and seasonal weakness combined with short-term deterioration in S&P and Nasdaq trend charts introduce caution.
Risk On
Neutral
Risk Off

Every week you'll gain actionable insight with:


