June 11, 2023
Weekly Market Outlook
By Keith Schneider

Happy weekend Gaugers. Hope you had yet another positive investing week. Thanks for visiting with us for a few minutes. Let’s embark on the Outlook together.
The markets continue to grind higher, albeit a bit quieter. On Friday, stocks faded into the close but still eked out a small (0.1%) gain for the week. See chart below:

The good news, as you can tell from the headline above, is that the S&P 500 entered a NEW BULL Market from the October 2022 lows. See chart below:

The End of the Bear Market:
Besides a 20% rise from the lows, there are signs that we are likely at the end of the “bear” market. We have posted a number of charts supporting this over the past few weeks. We have also shared positive prognostications from people like Ryan Detrick (of the Carson Group), that provide statistical evidence of what happens when returns have produced positive returns at certain points beginning and continuing through the first half of the year.
Please review our previous Market Outlooks to revisit these forecasts. Many of these charts, like the one below, show what might occur after the 20% rise from the previous market bottom.

PLEASE pay attention to the periods above including 1974 (stagflation) and 2002 (reemergence of the bear) when technology stocks continued their decline from 2000-2002. These two periods resemble in some fashion, the dynamics playing out in the current market environment.
Managing Director of Banc of America Savita Subramanian (Barron’s top 100 most influential women in Finance) states, “after crossing the +20% mark from the bottom, the S&P 500 continued to rise over the next 12 months 92% of the time (vs. 9% average overall) based on data going back to the 1950’s.”
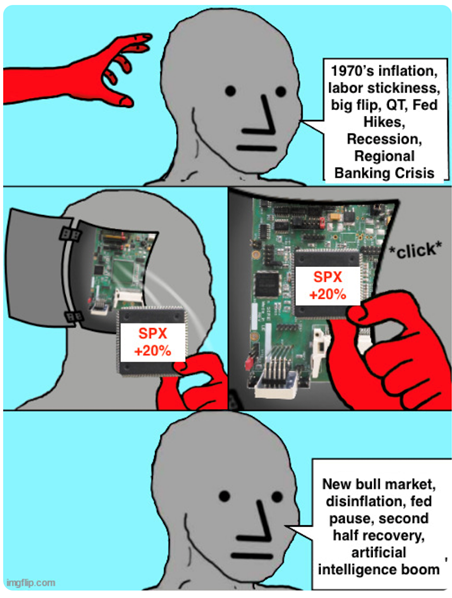
I loved the below cartoon I came upon this weekend. It sums up what the 20% off the bottom means, the enthusiasm for AI driving the market’s exuberance as well as the expectation that all the problems of the economy are now going to somehow disappear NOT.
According to AAII (American Association of Individual Investors), bulls outnumber bears for the first time in 18 months. (this is a positive sign)

What Sectors are fueling the returns in 2023?
The following chart illustrates what sectors of the S&P 500 are providing the most returns so far in 2023.

The number of stocks that are below their 50, 100 & 200-day simple moving averages (SMA) is improving. See chart below:

As expected, the Information Technology (XLK), Consumer Discretionary (XLY) and Communication Services (XLC) have more than 50% of their stocks above these important moving averages and are still leading the markets higher. (we are rotating into one of these 3 sectors in one of our investment strategies on Monday. If you are a subscriber, look closely for this allocation and if you are not but want more information contact [email protected], or schedule a call with him here, and he will assist you)
Leadership is broadening out.
We have written on numerous occasions (as has Mish through her Mish’s Daily, click here to review), that this has been a very narrow market. I am confident that you have read your fair share of media concern that this rally has been only concentrated in the top 7-15 mega cap stocks driving the index. If you haven’t had a chance to read last week’s Market Outlook, go here to review our take on the narrow leadership.
The good news, thus far, is that leadership is broadening out, and market capitalization is beginning to rotate. See chart below:

Non-participants so far this year, small and midcap stocks began a snapback rally this past week. It was a good week for both areas of the market. A good sign. See charts below:


Some of the factors that could be helping to drive the markets higher.
Over the past few months, we have addressed numerous ongoing economic concerns we (and the rest of the world) have.
These factors include continued high inflation (and stagflation), higher corporate operating costs, lower earnings expectations, and lowered market valuation, consumers pulling in spending, energy costs, purposeful higher unemployment desired by the Fed and parts of the economy that may have added friction (commercial real estate) and the many indicators that illustrate our slowing economy.
So given these factors, what is fueling the stock market’s move higher?
After the March-May regional bank crisis, along with recent economic numbers that show the persistence of inflation, one would have to look at the Fed’s balance sheet and its recent and positive effect on providing liquidity that inevitably is showing up in growth stocks and providing the recent strength in the stock market.
Behind the scenes.
Here are some important charts (and narrative) showing that while the Fed continues to drain liquidity from their balance sheet (one form of FED tightening) they are also in the background providing liquidity into the emergency lending facility which is being used by institutional and retail customers for money market inflows. (Money markets are continuing to grow and now have more than $5.4 trillion in them).
This is proof that consumer sentiment remains negative and is helping to drive money into money market funds. However, that is also just one symptom of the non-trust consumers feel about keeping their money in regional as well as large banking institutions. These banks are either raising security issues or, in the case of large banks, paying a negligible amount of interest to their depositors. See below:


While the Fed is providing liquidity, especially for the emergency bank funding program, they are subsequently selling off securities in an attempt to drain liquidity and keep their commitment to QT (Quantitative Tightening) as part of reducing credit demand and slowing down the economy. See below:

There are very clear signs that some of the Fed’s expansion of their balance sheet is showing up in stocks.

What’s next? Why we think caution is still advised.
There are signs that this market rally may be a bit overdone and stretched. There may be a good reason for a pause or minimizing risk in the near future. We only share this narrative (and charts) to provide a fair and balanced approach to our Market Outlook and investment perspective.
We thank Minaz Hassam, one of our friends and loyal All Access members for his contribution with these charts.
The CNN Fear and Greed index, shows extreme greed and some of the components of that index are screaming “caution is advised”.

Here is how that indicator has played out over the past year. See chart below:

The S&P 500 Index is currently sitting at resistance. Will it break through?

One of the major contributors to the Fear/Greed gauge above is the volatility index (VIX). See charts below:

Typically, when it trades this low and with an absence of fear, it triggers a potential “buy” signal in volatility. (that means increased near-term risk). See the chart below:

However, other analysts and market technicians point out that the volatility index can stay lower for longer and has demonstrated this in the past. These unusual periods, as evidenced above, might only need short-term consolidation and/or a small correction to build a long-term healthy market.

One of our favorite analysts, Ryan Detrick, CMT (of Carson Group) is great at putting market conditions in perspective. This week he stated:
“The VIX closed beneath 14 for the first time in more than 3 years today (June 7). Longest streak above 14 since 5 plus years ending 8/13/12. Did you know the S&P 500 gained 18.3% the next year after that sub-15 print back then? Yeah, low volatility isn’t always a bad thing.”
Even though it seams like so long ago, investors vividly recall the 2007-2009 great financial crisis and their stock market losses that took years to recover from. The bear market of 2022 likely created and recalled similar fearful memories. These memories can have long-term effects on an investor’s psyche.
This tweet, with its commentary and illustration, sums up investors’ fear of loss quite well and provides some healthy bullish context.

The Fed meeting this week. More volatility potentially.
The upcoming Fed meeting this week is going to be the first in years where there is no clear consensus on the interest rate decision. Every meeting since the Fed began to raise rates has had a clear group consensus. Now futures show only a 25% chance that rates will increase and a 75% chance that they don’t. Interest rate decision consensus will be difficult to achieve going forward. This is likely to spur more volatility, not less.
Our take: The Fed may “pause” on raising their overnight lending rates when they meet this week. However, unlike other organizations, we do not think they are done. We would rather see a 25 bp or even 50 bp raise and then be close to done. The market may interpret a PAUSE positively, but their language and dot plot (future expectations of potential future raises) could be perceived as negative. The Consumer Price Index news released on Tuesday may sway their consensus view for Wednesday.
Some of the narrative (and charts) above could give you more ammunition for taking on more equity exposure. If you follow Mish either through her Mish’s Daily or through her numerous and frequent media appearances (you can review the most recent ones here), you may obtain additional inputs and perspective about the economy and where we think opportunities are unfolding.
Or, if you are a subscriber or user of our investment strategies, you are aware that most of them are fully invested. While these strategies are doing well (some better than others) you should be acutely aware that each of them incorporate risk-management which includes profit targets and active stops. We call this SMART investment methodology. (SIM).
If you would like more information about using these strategies (or All-Weather Portfolio Blends) for your investments or you would like our affiliated regulated entity MarketGauge Asset Management to manage the assets for you, please email me at [email protected] or schedule a free strategy call here.

Risk On
Neutral
Risk Off

Every week you'll gain actionable insight with:


