March 15, 2026
Weekly Market Outlook
By Geoff Bysshe

Markets tend to focus on one big idea at a time, and right now, there's no question what that idea is and should be - the war with Iran because…
Bull markets and strong economies are killed by “shocks.”
The difference between a problem and a shock can be measured in time and magnitude. I don’t think many investors would debate that the magnitude of the war with Iran qualifies as a shock. Now the question is, “How big will the shock be?” For the bulls looking for a resumption of the bull market,…
Time is running out.
War is raging in Europe and the Middle East.
Global trade is choking.
The American consumer’s buying power is eroding daily as oil prices skyrocket.
The mid-term elections are getting closer.
Any of the above could change the outlook for stocks.
2025 enjoyed a bull market and an incredibly positive outlook, in which the focus was on the AI boom being so big that it was creating fears of a bubble. The growth opportunities were so strong that it was creating problems for energy costs and job displacement.
I’m optimistic that the AI revolution, space industry, blockchain tech, dramatic advances in medicine and healthcare, and more will provide the foundation for the growth stories that will power the economy and bull market higher, but time is running out for it to continue on the trajectory it had in 2025.
Bull markets are patient, and they “climb the wall of worry” until they give up. That process of giving up is slow, and then all of a sudden.
Two Big Factors To Watch
#1. Short Term: Oil’s Influence
As you can see in the table below, the oil markets are now the tail wagging the dog. The table's last column shows the daily correlation of each index and sector to USO (oil ETF) over the last year. The second-to-last column shows the correlation since the war began.
If you’re not familiar with reading correlation data, correlation ranges from +1 to −1:
So the −0.80 reading for SPY and USO is a very strong negative relationship.
When oil (USO) has gone up over the past 10 days, stocks (SPY) have tended to go down, and when oil has fallen, stocks have tended to rise — and they’ve been doing this very consistently.
With the correlation so high and so widespread throughout the sectors, it's easy to see how investors can believe that a quick resolution to the war could lead to a quick resumption of the bull market.
Plus, recent history has trained investors to believe that you need to be in the market before President Trump says something that changes the environment enough to prompt a rush back into stocks.
FOMO has become an acceptable buy-the-dip strategy. As a result, many investors may get surprised when “this time is different” because they aren’t focused on the market’s next big ideas that are developing in the shadows of war.
The surprise factor may be quite big considering how the market has responded to the war.
Depending on how you define "the market", it could be said that the market is holding up quite well, considering the historic move in crude oil and the historic nature of the war in the Middle East.
In fact, we highlighted this condition in last week’s Market Outlook, “Was Last Week The Tipping Point For Stocks?” The S&P 500 and NASDAQ 100 indexes were still relatively close to their 52-week highs and not in the correction zone that statistically increases the odds of large one-day drops and accelerating declines.
Markets continued to fall last week, but the market’s message from last week's price action isn't evident in the major indexes.
As you'll see in Keith's Weekly Market Analysis video, the indexes are sitting at key technical support levels, arguably the bull’s most important sector is holding on, and some indicators look oversold. However, as you’ll also see in the video, the market is much weaker than the indexes suggest.
As you can see in the chart below, which ranks indexes, sectors, and theme ETFs by their percentage change since the invasion of Iran, the SPY and QQQ have held up well, but the equal weight S&P 500, RSP, has fallen harder. So has the broader IWM.
The other notable change over the last week was the extent to which the leading sectors continued to fall. One of the leading sectors that demonstrated economic strength outside of semiconductors was the industrial sector, XLI.
As you can see in the charts on the Big View Sector Summary page and in the chart below, XLI was one of several economically sensitive sectors showing strong leadership prior to the war, which began at the start of March. The move of the leadership and volume trends lines under their respective blue lines indicates a loss of leadership and institutional selling.

If you look at how many of the sectors’ leadership and volume lines rolled over the last two weeks, the market looks more like one that’s hiding in large-cap tech than one that is confidently looking past the Iran war.
#2. Long Term: GDP and Inflation
Last week, the market was completely focused on the price of oil and hoping for confirming news that the war would end ‘soon’, according to an unreliable source.
Meanwhile, there were two important economic reports that commentators dismissed as less important because they were pre-war data.
The report may be less likely to impact the markets last week, but they are very important in tracking what investors are going to be faced with when the war is no longer the market’s primary focus. This time may come before the war ends.
The data was one of the Fed’s favorite gauges of inflation, core PCE. The good news is that it was reported where it was forecasted, but the bad news is that it is still more likely it’s breaking up than trending down.
See the chart below.
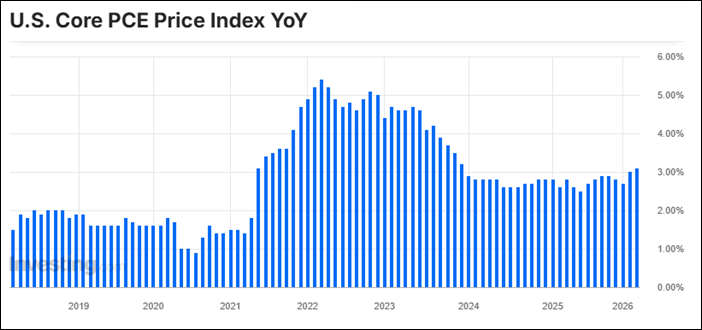
The chart suggests that the foundation of inflationary pressure is strong and much higher than the Fed’s desired level. Stocks may have shrugged it off, but the bond market didn’t. The long end of the yield curve saw big losses, which means higher rates, which is going to be a big problem for stocks if growth slows and/or if the war’s impact is viewed as contained and rates don’t retreat.
Speaking of slowing growth, on Friday, the second revision of Q4 2025 GDP was released.
Note the following pattern in the chart at table of data below.
2025 (Q3) was a robust 4.4%. Then the 2025 (Q4) first preliminary read came in at 1.4%, which was half of what was forecast. Next, on Friday, the second preliminary read reported half of the expected growth again!

Analysts were quick to point out that the drag from the federal government shutdown was a major and temporary contributor to the weakness, but this known weakness also proved larger than first reported.
Fourth-quarter GDP growth, which was expected to be 2.8% a month ago, is now down sharply to 0.7%. The weakness reflects weaker exports, softer consumer spending (especially in services such as healthcare), and lower business investment, including manufacturing.
Economists expect growth to rebound in early 2026 as the shutdown effects fade, and the Atlanta Fed’s GDPNow model projecting about 2.7% growth.
However, the report raises concerns about the underlying strength of the economy, which is a key argument for why the bull market can keep running higher.
Consumer spending, which drives most of the U.S. economy, slowed significantly, and as we reported two weeks ago in this last week’s Market Outlook, “Was Last Week The Tipping Point For Stocks?”, the labor market isn’t just cooling. According to Rick Rieder, BlackRock CIO of Global Fixed Income, “If you strip out healthcare over the last 9 months, the number of jobs is NEGATIVE 358k.”
In short, the data does not point to an economic collapse, but it suggests the economy may be losing momentum faster than previously thought. If growth fails to rebound as expected, the economy could shift from being a tailwind for markets to becoming a potential headwind for investors.
You don’t need to be an economist to see when the stock market starts to sell off on fears of economic weakness, and that is not a dip one should buy too quickly.
If the investors shift their myopic focus from the war to the economy, you should not be surprised if the result is disappointing.
It’s very much a matter of time.
Want Help Making Sure You See What’s Coming?
If you'd like access to the MarketGauge indicators, strategies, automated trading models, and more, contact us.
Best wishes for your trading,
Geoff Bysshe
Co-Founder
(I also post on LinkedIn)
 |
 Every week we review the big picture of the market's technical condition as seen through the lens of our Big View data charts. Every week we review the big picture of the market's technical condition as seen through the lens of our Big View data charts.
The bullets provide a quick summary organized by conditions we see as being risk-on, risk-off, or neutral. The video analysis dives deeper. |
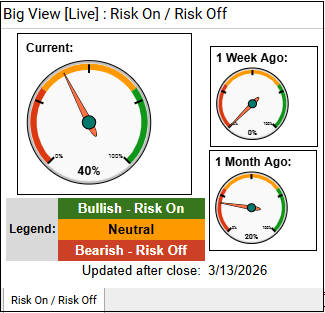
Summary: Markets remain broadly risk-off with weakening internals, deteriorating breadth, and all major indexes declining toward their 200-Day Moving Averages as geopolitical tensions, inflation pressures, and a stronger dollar weigh on sentiment. Semiconductors remain a notable area of strength and oversold conditions across several indicators suggest the potential for a sharp reversal, though elevated volatility and defensive leadership warrant caution.
Risk On
Neutral
Risk Off
Markets remain in a risk-off posture with weakening breadth, negative phase changes across the Modern Family, and all four indexes drifting toward their 200-Day Moving Averages. However, conditions are becoming increasingly oversold as reflected in the McClellan Oscillator and several stretched Modern Family members, suggesting the potential for a sharp reflex rally if key support levels hold.
Bullish Scenario (Tactical Bounce):
If the indexes hold their 200-Day Moving Averages and market internals begin to stabilize (improvement in the McClellan Oscillator, new high/new low ratio, and color charts), look for tactical long opportunities in the strongest leadership areas. Semiconductors remain the clearest relative strength group and could lead a short-term rebound. A bounce could also develop if volatility continues to ease and breadth begins to repair, particularly into the seasonal strength that often develops later in the month.
Bearish Scenario (Break of Support):
If the major indexes break decisively below their 200-Day Moving Averages and breadth continues to deteriorate, expect further downside pressure. Under this scenario, maintain a defensive posture with reduced equity exposure, avoid weaker sectors such as regional banks and retail that have already shifted into distribution phases, and focus on areas benefiting from current macro trends such as energy and soft commodities, which are showing strength amid rising oil and geopolitical tensions.
Risk Management:
Position sizes should remain smaller than normal while volatility stays elevated. Watch the 200-Day Moving Averages across the indexes as key support, along with ongoing readings in market internals. If breadth begins to improve and oversold conditions unwind constructively, increase exposure selectively; if conditions worsen, prioritize capital preservation until the market establishes a more durable base.

Every week you'll gain actionable insight with: