August 17, 2025
Weekly Market Outlook
By Geoff Bysshe
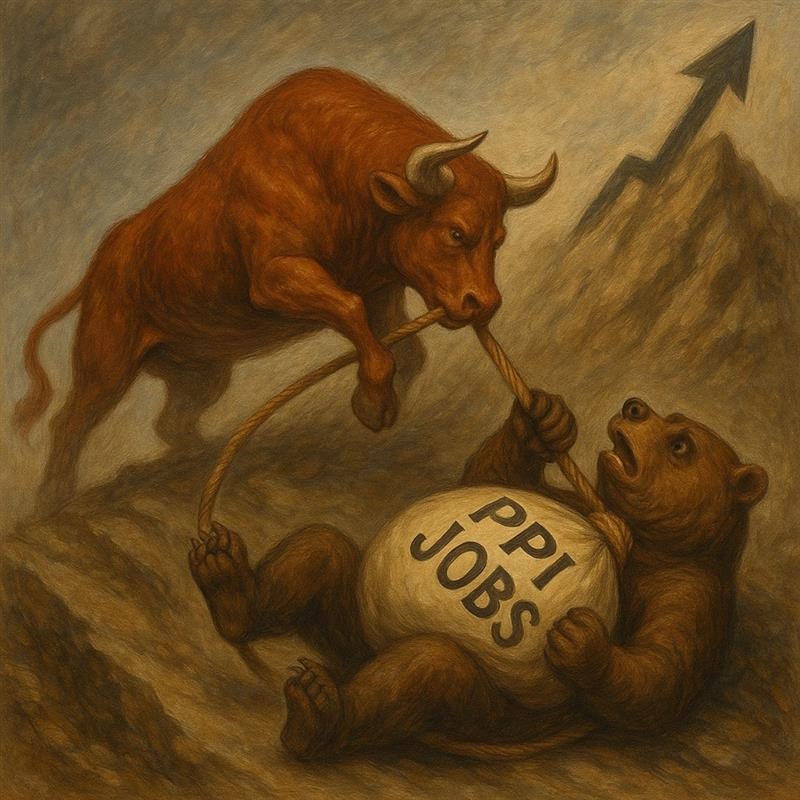
This week, the economic data gave both the bulls and the bears something to justify their position.
Unfortunately, for the bears, the fear of inflation and a weakening job market isn’t slowing the bulls down.
In fact, previously cautious areas of the market joying the bulls party this week.
Are the bull confident in the economy, the Fed or both?
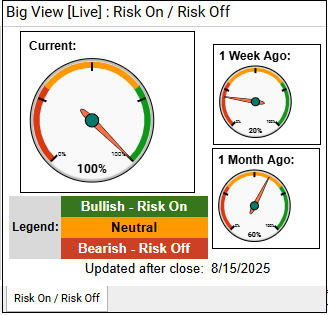
Last week the market had a pretty strong opinion.
In this week’s issue we are releasing a new section…
“Actionable Trading Guidance”!
Inflation
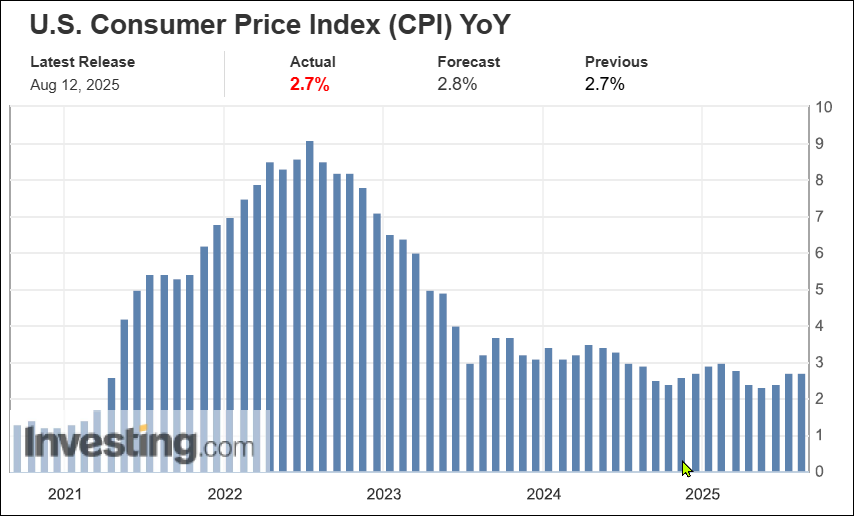
On Tuesday, CPI was reported as slightly better than expected.
As you can see from the chart and data below, the reported 2.7% inflation rate beat the expectations of 2.8%. However, the trend hasn’t improved, the report matched the previous level at 2.7% below, and 2.7% remains well above the feds target. Nonetheless, this further in emboldened and the bulls enough to rally the beleaguered and interest rate sensitive areas of the market like small caps and the housing sectors.
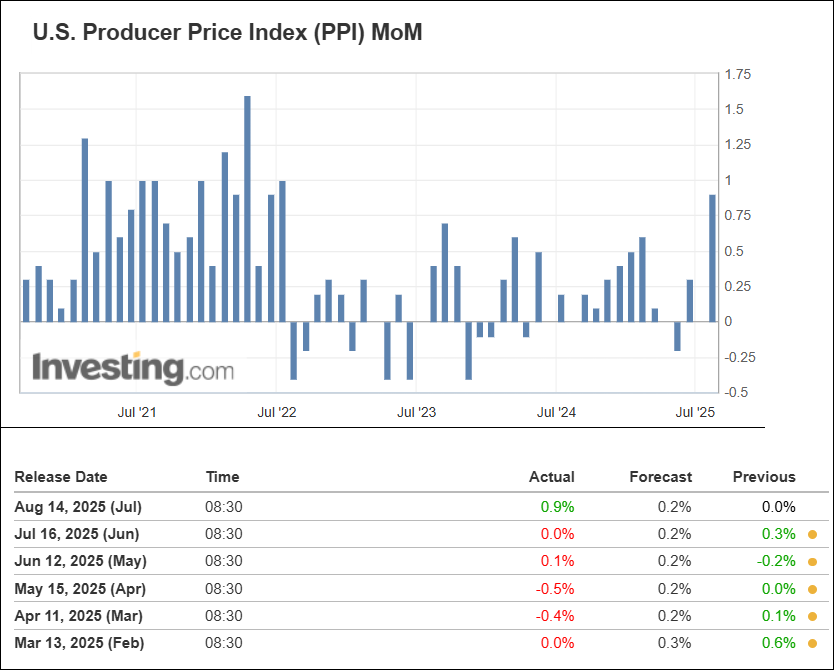
On Thursday, the inflation picture became less complacent when PPI came in hotter than inspected.
As you can see from the chart and data below this report was much hotter than expected, the hottest since July 2022, and it breaks a streak of better than expected reports since February.
Sentiment
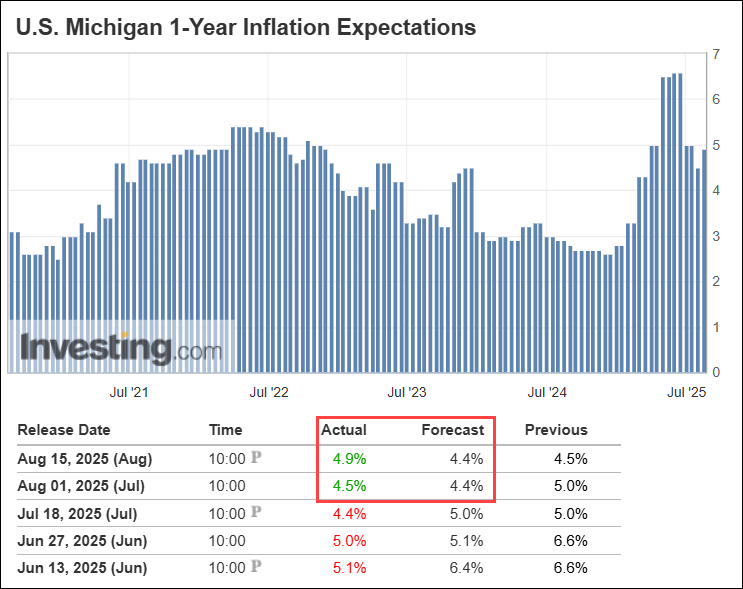
As you can see from the chart and data below the Fed isn’t the only one worried about inflation.
The trend in recent months of diminishing fears took a turn for the worst in this weeks U Mich survey.
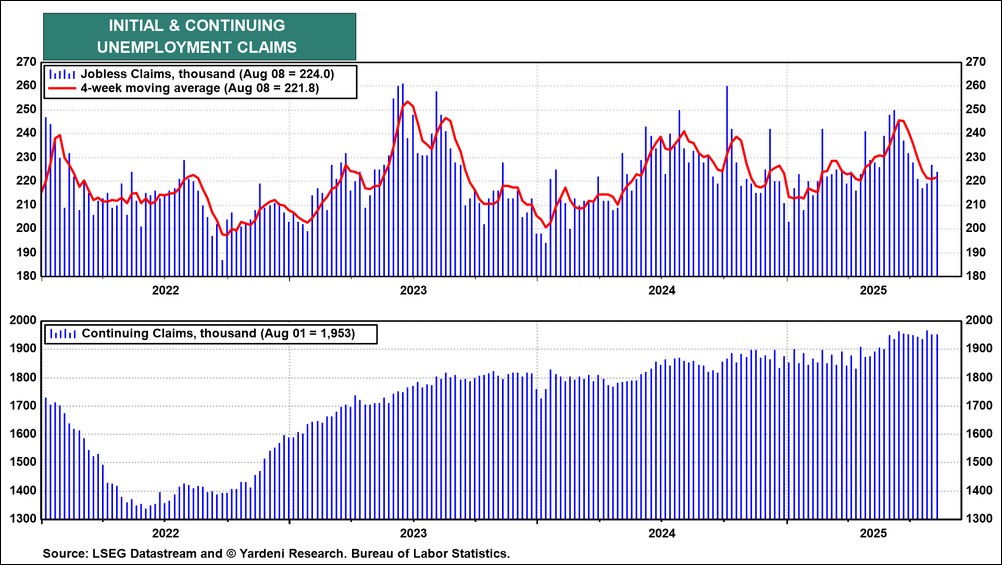
The Labor Market
Ed Yardeni, who has called the bull market brilliantly, summarizes the labor market like this…
“Jobless claims remained low during the week of August 8 (chart). That suggests that layoffs remain subdued. On the other hand, continuing claims remain relatively elevated, indicating that it may be taking longer to find a job.”
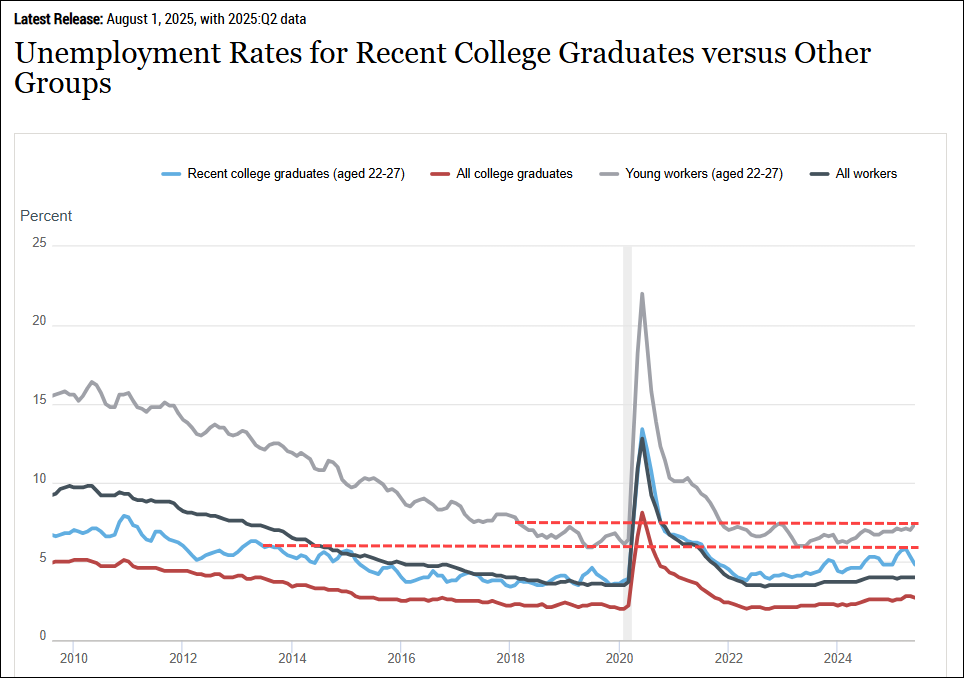
Unemployment
It’s not only hard to find a job when you lose one. As you can see from the data below it’s difficult to find a job if your young and or recently graduated.
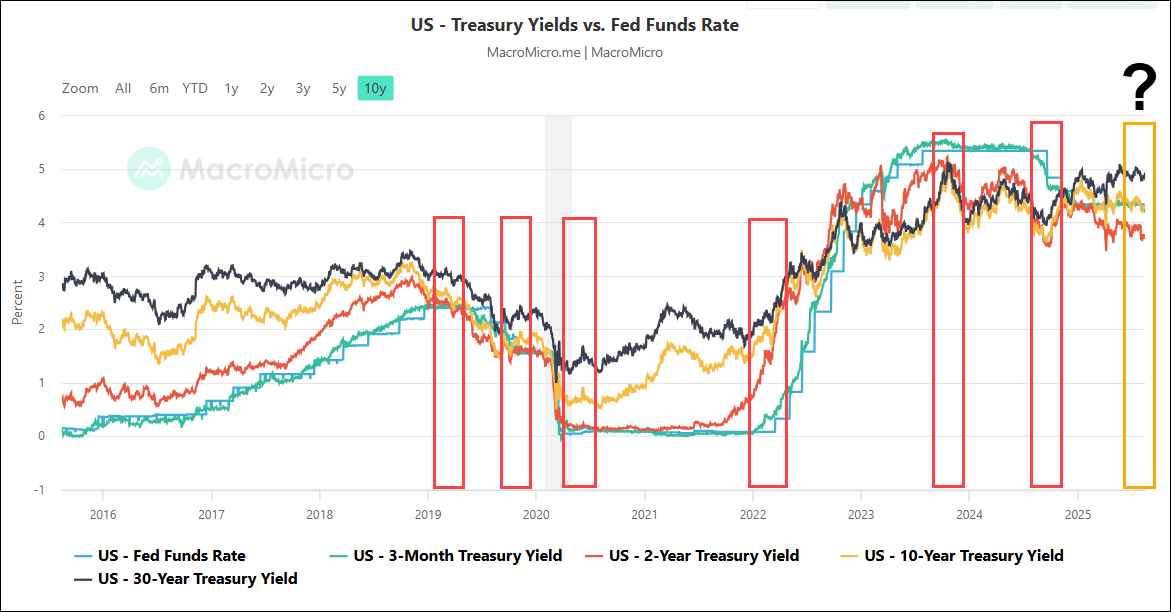
Interest Rates
In the balance between inflation and a slowing labor market is optimism for a Fed rate cut.
The 2-year note is often looked at as a market indicator for the future direction of Fed Funds.
The redboxes in the chart below indicate where the Fed shifted policy or paused. Notice the trend or change in trend in the red line (two year notes) around these time frames.
Currently, there’s been a significant period in which many have argued that the Fed should cut with the justification of where the two year being substationally lower that the Fed funds rate housin.
So why should we believe that the time is now?
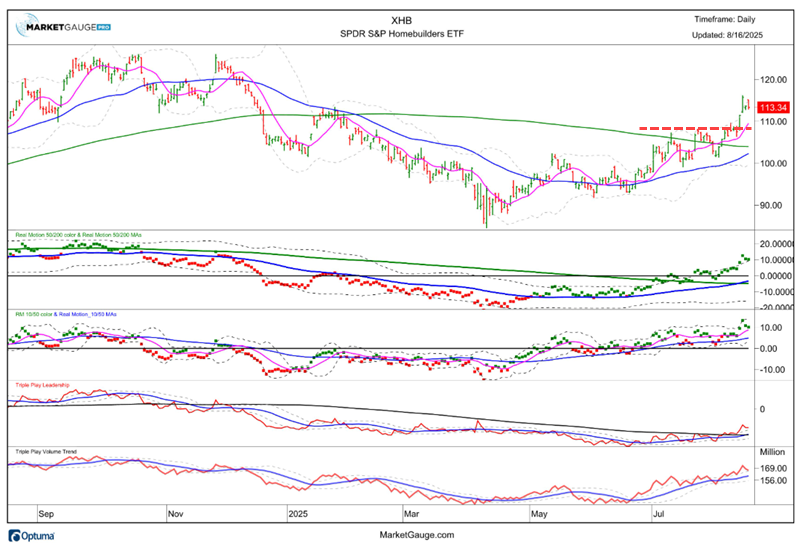
Rate Sensitive Housing Sector
One sector that is likely to move higher on the belief that lower rates are in the near future is the housing sector. Perhaps last week’s move up above critical resistance levels in the housing sector (XHB, shown below) and the small caps (IWM) is good reason to believe September will be the month that the Fed cuts.
It could also indicate that regardless of the Fed, short term rates could go lower.
Looking Forward
Lower interest rates would likely favor the market’s ability to broaden out, and that would be bullish. However, the bull has demonstrated that sectors less sensitive to interest rates like big tech and semiconductors are willing to run regardless of what the Fed does.
It’s a tough time to be bearish, but a dangerous time to be complacent.
Our simple rule of thumb for discretionary traders is stay with leaders trading above their July calendar range high and avoid areas of the market that fall below their July calendar range low.
This keeps your work simple in the summer and sets you up to be well positioned into the fall.
 |
 Every week we review the big picture of the market's technical condition as seen through the lens of our Big View data charts. Every week we review the big picture of the market's technical condition as seen through the lens of our Big View data charts.
The bullets provide a quick summary organized by conditions we see as being risk-on, risk-off, or neutral. The video analysis dives deeper. |
Summary: Markets rose with strong gains in small caps, new highs in the S&P and Nasdaq, positive sector rotation, and leadership from clean energy and solar, while volatility fell to its lowest level since December and risk gauges moved fully risk-on. Neutral signals include mixed market internals, even distribution/accumulation volume, and short-term overbought conditions in large-cap foreign equities, with Bitcoin, gold, and fixed income remaining range-bound.
Risk On
Neutral
Risk Off
For Actionable Trading Guidance:

Every week you'll gain actionable insight with:


