September 22, 2024
Weekly Market Outlook
By Keith Schneider

Welcome back readers. Hope you had a profitable week in the markets.
The Fed pulls the trigger.
In the last two Market Outlooks we expressed our strong belief that the Fed would lower the overnight lending rate at their upcoming Fed meeting which occurred last Wednesday. If you have not had a chance to read last week’s Market Outlook, you may do so by going here.
We suggested the Fed would do no more than a 25-basis point reduction. I was wrong. Early in the week the “betting pools” had risen to over 50% that the Fed would lower by 50 basis points. My estimation was based on “sticky inflation” and the Fed taking an initial cautionary easing. We provided evidence over the past few weeks by showing graphs illustrating how large the spread between the downward trending inflation and short-term (2-10) year Treasury paper has become. Reason enough for the Fed to take action.
Most economists felt that the Fed had to reduce their restrictive stance and send a strong message to the market that the easing cycle is now beginning. No doubt 50 basis points did exactly that.
What Does the Fed know?
Besides the historically widespread (between the rate of inflation and the Treasury market as discussed above), the Fed is acutely aware that job growth is slowing, and that GDP has trended down over the past few quarters. They understand all too well that this soft landing could easily turn into a full blown recession if rates stay too restrictive.
Was this big of a cut necessary:
Fed vs. financial conditions. "The last time the Fed cut this much when financial conditions were set this fair was way back in 1992."

There are plenty of pundits who believe there is a real recession risk, which is why the futures betting market had odds by Wednesday morning of greater than a 65% chance the Fed was cutting by 50 basis points.
Jobs, jobs and jobs.
You may recall back in July the jobs report came out well below expectations. Then in August the Labor Department adjusted job growth by -800,000+ jobs that were not created. The final adjustment in September, along with the previous revision, stated that over 1,000,000 jobs were NOT created as the BLS reduced job growth substantially. THIS IS WHAT THE FED took into significant consideration when determining to lower rates and do so by 50 basis points.
Remember that part of the Fed’s dual mandate is for a stable job market. Seeing signs that unemployment may jump up fairly quickly, motivated the Fed’s aggressive lowering action and rhetoric about more to come that followed.
Here is a description followed by charts depicting this unemployment situation:
"The median monetary policymaker thinks the unemployment rate (currently 4.2%) will be at 4.4% at the end of this year and the next ... Twelve monetary policymakers think the risk is that the unemployment rate goes up even more than they expect."

Global growth is weakening.
While the US Federal Reserve was lowering rates, other countries Central Bankers have been doing the same. The mantra amongst most developed countries is to ease interest rates and hope for soft landings in their respective economies. I guess if you had to look at the collective pattern, all countries emerged out of Covid by over stimulating their economies and some of that sugar high has completely worn off now. But most countries including our own are hoping for a “soft landing”. Let’s hope that our economy accomplishes this without too many hardships. See below.
Despite pessimistic views on the global economic growth over the next 12 months (net 42% expect weaker, top chart), a 'soft landing' is increasingly seen as the most likely outcome (bottom).

While Banc of America above provides ammunition that 79% say we will experience a soft landing, The consensus provided above however, is not in alignment with the interest rate markets. See chart below:
Rates market vs. FFR. "Despite surveys showing that the consensus is expecting a soft landing, rates markets are pricing in a full-blown recession."

There are others too who are skeptical of a “soft landing”. One of those outspoken that we may see harder times ahead is Jame Dimon, CEO of JP Morgan. In recent speeches he has been highly critical that the Fed’s restrictive monetary posture went on for far too long and may be putting the US in a position to endure a “hard landing, aka a recession” in the near future.
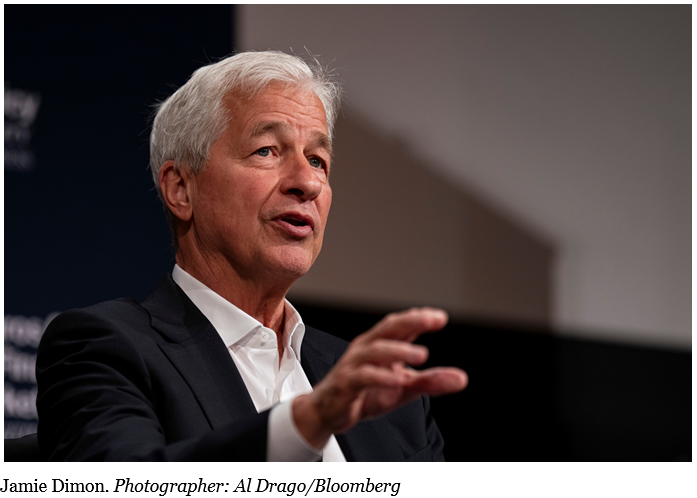
Mr. Dimon said he remains skeptical about a soft landing in the US following the Federal Reserve’s first rate cut in more than four years. He said at the Atlantic Federal event in Washington on Friday that “he wouldn’t count my eggs” on that outcome. He went on to say “I am a little more skeptical than other people. I give it lower odds. I hope it’s true (what the Fed says about lower inflation) but I’m also more skeptical that inflation is going to go away so easily”.
The UNSTOPPABLE Markets
After the Fed easing on Wednesday and the prospects for another 50 basis points to come for the rest of the year, the markets closed with a whimper. However, Thursday the markets took off and the Dow and the S&P 500 hit new all-time highs once again.
The S&P 500 is now up 5 of the last 6 weeks. See below:

One of the positive technical signs of the bullish nature of the markets is the New Highs/New Lows count on the different markets. Some of our Algorithms factor in technical indicators like these to determine the risk and rewards of being invested in different areas (including capitalization and sectors) of the markets. See chart below:

As we have pointed out for several months now, the place to be when rate cuts begin is smaller capitalization stocks. Smaller companies, who are dependent more on borrowing from their bankers, are major beneficiaries of a rate reduction.
The Russell 2000 celebrated the Fed’s easing on Thursday but also rallied hard for several days leading up to the rate reduction. Is it now poised to continue even higher. Maybe not as the chart shows below:
R2K streak. The Russell 2000 has now risen for 7 days in a row, a feat accomplished only 27 other times while also trading above the 200 SMA. Forward returns have been mixed though.

There are other positive signals that the market is on solid footing. One of these signs is the positive net capital inflows into the stock market by institutions. See additional information below:
Net capital flows "Institutions bought a net $6.82 billion in stocks through August ... the first month that institutional investors were net buyers in equities since December 2023."

I have been writing in these weekly outlooks, with some degree of consistency, that when the markets are up the first month, the first 6 months and not yet in a recession the S&P 500 has a good track record of continuing to produce good returns. I have published numerous charts and graphs, including those by Ryan Detrick pointing out the statistical bias of staying the course in the markets. We hope you have so far in 2024.
Here is another chart depicting the likely performance going forward after a positive first 182 days. In the chart below there are similar periods to 2024 that offer a comparison. We also emphasize, as we have many times before, that we are in an election year and that provides additional wind at our backs. See the chart below:

Two weeks ago, I told our readers that seasonally, the S&P typically does well between September 8 to 18. I suggested then that we were entering a positive period. I am pleased that this held true this year. However, from a seasonality perspective, we are now entering the latter half of September which is a bit more difficult. So just beware that we are “not out of the woods quite yet”. See the chart below:

Given the Fed’s commitment to bring down rates over the next year and a half, what are the attractive areas of the stock market to be invested in? Here’s a view from one consulting firm that evaluates the true value of stocks given forward P/Es and areas that are crowded versus other less crowded (and less expensive) areas for stock investments.
Crowding vs. valuation. "Today, Financials and Industrials appear most at risk to underperform, whereas Internet and Retail stocks seem to be the least at risk.

Another UNSTOPPABLE asset class.
For the past year, with an emphasis on the past few months, we have continuously written about the metals market being a major beneficiary to an easing cycle. This has been spoken about numerous times by Mish on her National TV appearances. As I referenced last week, going back to last October, Mish has been pontificating at conferences, podcasts, interviews and TV appearances that she felt Gold, Silver and Miners were the place that could most benefit from an upcoming Federal Reserve easing cycle.
THE GOLD RALLY IS FOR REAL. See below:

Why?
Rate cuts generally imply lower yields and a potentially weaker dollar-a recipe for stronger gold and silver prices as other income-generating safe haven assets become less competitive and commodities become cheaper to purchase.
While inflation is falling yet staying elevated, Gold is considered an inflation hedge and with a weaker dollar and much more geopolitical risk, investors have been steadily moving into the yellow metal.
This was another positive week in the performance of the metals. More importantly, given the Fed’s first easting, this is a good time to take a bigger position in this asset class. See charts below:
Gold vs. first cut. "After a cut, there has only been one time, 1998, when gold has trended significantly lower after a rate cut throughout the next year, and even then, close to the one-year mark, it surged as the Dot Com crash started."

It is important to review the last nine major rate-cutting cycles since the 1970s to see how gold has behaved in those periods. Gold has generated an average 12-month gain of 3.7% following the first rate cut. And the peak in gold performance has historically been around the six-month window where average gains reached 10.8% suggesting the current upside momentum could continue well into the first quarter of 2025. See below

Several of our investment models are currently invested in the metal markets. We have been seeing significant gains in these areas. If you would like more information on these specific investment models, please reach out to [email protected] for additional information.
While we have been seeing good gains in Gold and Silver and a few gold mining stocks, we offer up the following chart as to emphasize that this has been an UNSTOPPABLE area of the markets to invest in. See below:

Our hope, as always, that you got some useful and instructive information from this week’s Market Outlook. We appreciate you spending some time reviewing our thoughts on the Economy, the Markets and some opportunities that lie ahead.
We all hope you have a productive and profitable week ahead.
![]()
 |
 Every week we review the big picture of the market's technical condition as seen through the lens of our Big View data charts. Every week we review the big picture of the market's technical condition as seen through the lens of our Big View data charts.
The bullets provide a quick summary organized by conditions we see as being risk-on, risk-off, or neutral. The video analysis dives deeper. |
Risk On
Neutral
Risk Off

Every week you'll gain actionable insight with:


