December 21, 2025
Weekly Market Outlook
By Geoff Bysshe

The market’s biggest illusions are often an investor’s greatest opportunities.
Every year, investors enter the market armed with predictions — what will outperform, what will fail, and what everyone should own. And every year, the market humbles most investors by reminding them that reality rarely matches expectations.
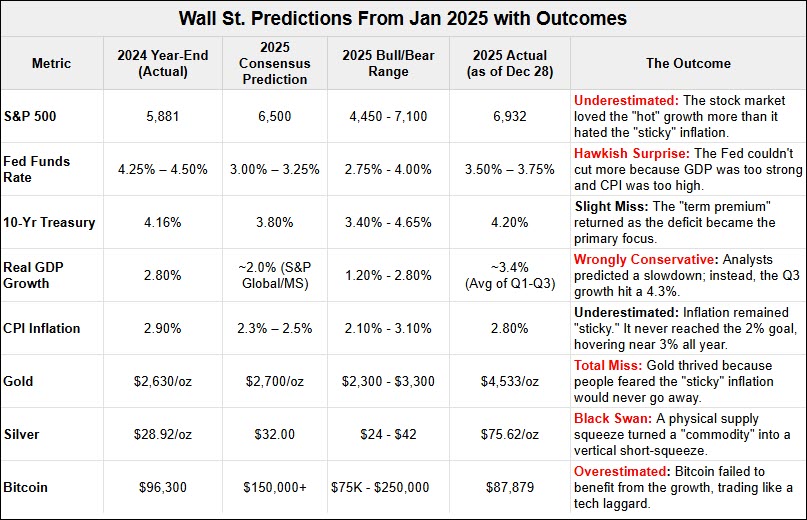
Last year (2025), the Wall Street professionals didn’t see the year’s biggest moves coming. They have the best information, but look at the “Consensus Predictions” vs. the ”2025 Actual” columns in the table below.
Markets are very hard to predict. It may be fun. I may be helpful to formulate a “base case” assumption, but it’s no way to trade or invest.
There is a better way.
You Can Read The Market Like a Map or A Close Friend's Personality
Markets are not random. They can be complicated in the same way people are because they reflect human behavior in the same way you'd describe a person's personality.
When you understand a specific friend or family member's personality, they become "predictable" by reading their mannerisms that send messages - sometimes loud, and usually subtle.
The challenge isn’t that the message is hidden — it’s that most investors aren’t aware of how to read it.
At MarketGauge, we believe you can learn to read it and become a much more successful investor as a result.
In fact, long before AI became a hot topic, we built quantitative trading systems that outperform the market and have lower drawdowns by exploiting the market's various personality traits during conditions that are easily defined. Identifying, understanding, and anticipating the markets in this way is often referred to as an 'edge' by quantitative-based traders.
Rules-based trading systems that navigate trends across any market instrument (index, ETF, crypto, stocks, etc.) eliminate frustrating emotions from decision-making and help you read the market’s anticipatory signals as they unfold, like following your car's navigation system on a road trip.
2026 Will Be "Different This Time."
The bull market is entering its fourth calendar year, and like any long-lived trend, it is maturing. The market still carries the personality of a bull market, but the behaviors that defined the past two years are already changing.
Rather than trying to predict the expected changes, we (and you) can use simple frameworks like maps to adapt and exploit the opportunities that these changes will create in 2026
With 2026 just days away, one of the simplest — and most revealing — of those frameworks is about to reset.
The Market’s Sleight of Hand in 2025
Every January, the market follows a predictable pattern that enables a knowledgeable, active investor to anticipate the primary market direction for the first several months and often the year.
While the media focuses on Wall Street predictions, we suggest you focus on investors' actions in the here and now.
Here's why...
2025 Revisited…
If you recall the stock and sector focused narrative at the start of 2025, it was dominated by enthusiasm for technology stocks, particularly Nvidia. At the same time, what seemed like a minor concern — the risk of recession — was quietly growing. By early January, market-based betting odds were already assigning close to a 20% probability to a 2025 recession.
While the loudest narrative fixated on Nvidia’s historic run and the promise of AI, momentum across the broader market was weakening. That combination — elevated expectations of a recession and fading momentum — is exactly what makes markets vulnerable to sharp corrections, "surprise" corrections like the tariff tantrum in April.
Trump's Liberation Day tariff announcement was intended to shock the world, and it would have rocked even a confident stock market, but investors were not confidently bullish when the news hit. The market's message leading up to early April was already signaling concerns about economic growth, which made the market more vulnerable than most investors anticipated.
Ultimately, the bulls were correct in that the January favorite sectors had a strong year as you can see with tech stocks experiencing strong performance after the tariff surprise.

However, during the tariff tantrum, the area that would ultimately become the market's best-performing segment in 2025 was quietly strengthening, as if "the market knew something that the majority of investors did not."
The chart below adds the best performing areas of the market, highlighting what most investors missed.

When the strongest group is added, the picture changes dramatically. Gold, silver, and gold miners were the standout performers of 2025.
How could such dramatic outperformance have been anticipated?
The same question applies to individual stocks. As we highlighted in a recent MarketGauge outlook, while Nvidia’s performance in 2025 was impressive and dominated the market narrative, it was quietly outperformed by nearly 100 stocks in the S&P 500.
The story investors followed wasn’t wrong — it was simply incomplete.
That sleight of hand is how markets work. Which is why the most important skill for 2026 isn’t prediction — it’s having a process or a framework that helps you identify or anticipate what the market will do next, and which stocks or sectors or asset classes offer the best opportunities.
The Signal of the Year: A Simple Anchor
Each year begins with a remarkably clear reference point that we call the January Calendar Range, and the Signal of the Year.
It’s defined by just two levels — the market’s high and low after the first 10 trading days of the year.
From there, the message is black and white:
When used properly, these levels enable you to define trigger points for entering trades, levels for defining and limiting your risk in trades, and a basis for determining when to be bullish or bearish any markets.
Calendar Range highs or lows provide opportunities for trades based on breakouts, breakdowns, and reversals at these well defined levels.
These levels are not only significant in the first half of the year. They are equally as powerful in the second half of the year.
For example, applying the simplest application of the Calendar range strategy to the sector charts from above, you will observe the following tradable patterns
The Calendar Range – Signal of The Year
The vertical dotted green line on the 10th trading day of the chart above indicates the end of the date range for identifying the high and the low for the Signal of The Year.
To determine the Signal of the Year levels for any sector, find its respective high and low prior to the vertical line.
Notice the following ways in which GLD, GDX, and SLV exhibited incredible strength during the crisis AND after.
Why do the Calendar Ranges work?
There are several market factors that support why the first half of the first month of the year is able to be so reliable at sorting out the market’s winners and losers.
After approximately 10 days of trading in the new year, short-term emotions calm down, and more durable trends persist.
The persistent trends have the personality traits we began this article discussing.
When you combine an understanding of a trend’s strength and personality with the timely inflection point of the Calendar Range levels you will see how they provide a reliable road map for entering and exiting trades that can last from a few days to an entire year.
In next week’s Market Outlook we’ll look at Wall Street’s 2026 market predictions and some specific methods for determining the best trends to expect to breakout or reverse at their Calendar Range levels.
If you'd like help taking advantage of the Calendar Ranges and Signal of the year, contact us.
Best wishes for your trading,
Geoff Bysshe
 |
 Every week we review the big picture of the market's technical condition as seen through the lens of our Big View data charts. Every week we review the big picture of the market's technical condition as seen through the lens of our Big View data charts.
The bullets provide a quick summary organized by conditions we see as being risk-on, risk-off, or neutral. The video analysis dives deeper. |
Risk On
Neutral
Risk Off
Maintain a measured risk-on stance. The market remains in bull phases across all major indexes, with recent pullbacks resolving through rotation rather than broad breakdowns. Strength in leadership groups, resilience in the S&P versus Nasdaq weakness, and bullish longer-term breadth measures support staying invested while emphasizing relative strength. Seasonal tailwinds have not asserted themselves, reinforcing the case to remain positioned but selective.
Lean into rotation rather than broad beta.
Overweight / Favor
Maintain
The divergence between S&P stability and Nasdaq weakness in new 52-week lows confirms an internal rotation, not broad risk-off behavior. The bullish Color Charts in S&P and IWM reinforce this view and support staying invested while favoring leadership groups.
All members of the Modern Family are in bull phases, supporting continued equity exposure. However, leadership is selective, reinforcing the need to allocate toward relative strength rather than equal-weight exposure.
Bitcoin (BTC) consolidation bears watching due to its historical correlation with risk-on equities during declines. A downside resolution would be an early warning signal, not yet a trigger.

Every week you'll gain actionable insight with:


