March 8, 2026
Weekly Market Outlook
By Geoff Bysshe

Last week will be remembered as historically significant in geopolitics and the oil markets, but it’s not clear that the stock market will receive the same recognition.
In Malcom Gladwell’s best-selling book, he explains that small actions or events can trigger a rapid and widespread change once a critical threshold—called the tipping point—is reached.
Last week was filled with more than a few small bearish events, but did they create a tipping point for the bull market?
Considering the events listed above…
How would you have answered this question if it were asked of you earlier this year…
“How will the market respond if all the events listed above happen in one week?”
Would you say the S&P 500 would be down less than 2%?
It was down 1.9%.
Malcom’s framework applies to investor behavior and markets quite well, in that markets tend to react to changing conditions slowly and then all at once.
Should we expect the “all at once” this week?
As always, we’ve got some rules based conclusions and some “market narrative” analysis that will help shed light on what to expect and when.
One interesting fact to get started…
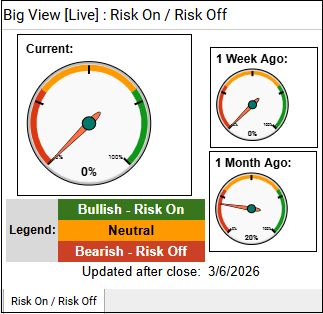
If you’re a reader of our weekly Big View bullets, which summarize the important conditions that you’ll find in the Big View Charts, you may notice that for the first time this year, there isn’t anything listed in the Risk On section.
Big View isn’t completely bearish, there are some neutral readings, and it focuses on sentiment and technicals. There are some fundamental indicators that still support the bull market, but we’ll get to them later.
Good News, Bad News, and Context
Bull markets don’t tip into bear trends because of bearish news. The tipping point is when markets stop ignoring bearish news, selling into bullish news, and sell with conviction on bearish news. The tipping point becomes clear when the narrative of “buy the dip” no longer prevails.
This transition in the narrative rarely happens quickly, often has false starts, and always looks obvious with the benefit of hindsight.
The invasion of Iran wasn’t a surprise, and when stocks opened lower on the news the reaction was to buy the dip. When oil continued to climb leading into Tuesday’s trading, the stock market opened lower, initially moved lower, but then recovered to close in the upper portion of its day’s range.
Tuesday’s buy-the-dip action was aided by crude oil pulling back from its highs. The market was looking at the war’s impact on our economy as another war that it could see through.
Wednesday the oil market consolidated and stocks rallied as one would expect from a bull market seeing through a temporary shock.
Thursday oil soared to new highs, but stocks only fell modestly. It wasn’t until news that the administration was considering new regulations on semiconductor companies that the SMH and the indexes took out prior-day lows. That dip was bought too, but with less conviction than the prior days.
Overnight Thursday, one of the market's most widely publicized fears of any Middle East conflict was realized. The Strait of Hormuz was determined to be unsafe for passing. This event has historically been thought to be a catalyst that would have the potential to crash markets.
Early Friday morning, with the Strait of Hormuz “closed” and oil soaring again over prior day’s highs, the S&P 500 futures were lower, but over their Thursday lows.
It was the surprisingly negative employment report that sent the stocks through their prior day's low.
The expectation was for 55k jobs, and a loss of 92k jobs was reported, with losses in almost every industry. Additionally, last month’s number was revised down slightly.
The chart below shows the trend that the market is concerned about.
Even more discouraging is that if you take out the jobs being added by health care, last month’s impressive gains of 137k gets wiped out.
According to Rick Rieder, BlackRock CIO of Global Fixed Income, “If you strip out healthcare over the last 9 months, the number of jobs is NEGATIVE 358k.”
The chart below illustrates this problem.
It’s not hard to see why the market sold off on this report.
It is hard to see how the market didn’t sell off more substantially.
The war and the oil shock have come in the context where there is a strong buy-the-dip bullish narrative grounded in the belief in a resilient economy, rising earnings expectations, high but stable inflation, expected future fiscal stimulus from tax refunds, and a weak but stable labor market.
How Volatile Was Last Week?
Oil
There are reports that crude oil’s weekly move was its largest ever. However, the context of the chart above (weekly crude oil) and below (monthly) reminds us that this price move comes from around a 4-year low, and even at $90, it’s in the middle of its 20-year range of roughly $40 to $120.
Bonds
The long bond, as tracked by the TLT, had its biggest weekly decline since Trump tanked them with the Tariff Liberation Day announcement. While the volatility is high, the context here, too, is a range-bound market. See the weekly chart below.
Semiconductors
Semiconductors, as tracked by the SMH ETF, has consistently been the leading group in the bull market, and it is the best proxy for the market’s belief in the AI revolution’s ability to generate growing earnings.
This group was at an all-time high just 7 days ago. This was the biggest weekly decline since Trump’s Liberation Day. Additionally, its price action of breaking out over weeks of consolidation only to immediately reverse and break below the multi-week range make it technically vulnerable.

Stocks: The S&P 500 (SPY)
Despite what should have been unusually high and very bearish volatility in oil (inflationary), interest rates, and the leading industry group, the downside volatility was not extraordinary. In fact, the week of Trump’s Liberation Day was over 3x worse, and we’ve had 4 other weeks since with equal or greater declines, as shown in the chart below.
Tipping vs. Inflection Points
Markets are harder to break when they are close to new highs. Bigger down moves tend to happen when a market has already “topped”.
Here’s where the major indexes are relative to their all-time highs.
For this article, I’m referring to the market’s “tipping point” as when the bullish narrative succumbs to a bearish one.
I’ll always define an “inflection point” as an area on the chart that is likely to lead to a meaningful price move in the form of a trend reversal or breakout.
There are some inflection points that can catalyze a tipping point. Prime examples of this are the 50 and 200-day MAs and the January Calendar Range low.
On Friday, the strongest of the indexes listed, RSP, the S&P 500 Equal Weight closed under its 50 DMA for the first time this year. This means all are now under their 50 DMAs.
Markets Don’t Crash When They Are Near 52-Week Highs, But…
In this Market Outlook column on September 21, 2025, I published, “The Investors' Paradox of Uncertainty and Time.”
In that article, I shared the following chart and conclusions from the data.
A counter intuitive characteristic of the stock market is that the largest 1-day losses don’t occur near 52-week highs. The market is more volatile during corrections or bear markets than in bull markets.
The dashed black line represents a 5% correction from the 52-week high.
Looking at the data since 1995 and accounting for every 1-day drop of 5% or more:
When this data was initially published, the S&P 500 was less than 1% from its 52-week high and well above its 50-day MA. Now the S&P 500 is 3.5% from its high and has spent most of the last month under its 50-day MA. Additionally, as we’ll cover later, it’s also under its January Calendar Range low.
Based on this data, last week’s resilience makes sense, but if the market continues to slide, the odds of the market reaching its tipping point increase, and the “buy the dip” trades get riskier with respect to getting caught in a big down day.
There are two steps to take.
Key Inflection Points
Like the condition of being more than 5% or worse,10%, from a 52-week high, the market’s location relative to its January Calendar Range low can catalyze a bearish tipping point.
Below you’ll see the key market with the Jan. Calendar Range and the 50 and 200 DMA indicators.
SPY: It’s bounced off the Calendar Range twice. A third challenge isn’t “a charm”. If this chart breaks lower next week, this suggests it will continue.
RSP: This being above its Calendar Range High and the 50 DMA has been a reason to believe the SPY will hold up. However, if it continues to decline, it’s negative until it recovers the Calendar Range High.
QQQ: This chart shows the power of the Calendar Range Low as it's been a ceiling since the QQQ slipped significantly under it. Until the QQQ trades over 620, this is bearish.
COMPX (Nasdaq Composite Index): This broader measure of Nasdaq is weaker than the QQQ.
IWM: Small Caps got off to a strong start in January, but unlike RSP, or SMH it didn’t breakout to the upside and now it's rolling over and breaking under the 50 DMA.
SMH: Above, I described a weekly reversal pattern in the SMH, and here you see that it’s happened around the Jan. Calendar Range High, creating a reversal pattern on this indicator that is lining up with a break of the 50 DMA.
What To Look For Next Week
The positive news is that last week, the bullish narrative enabled the bulls to be optimistic that the bullish trends in earnings expectations (we discussed this last week) and a stable state of GDP growth would enable the market to see through a temporary supply shock created by a “quick war” with Iran.
However, even though stocks seemed to hold their own, the increased breadth of the market correction (as you’ll see more about in Keith’s video), and the breaking of key inflection points like the 50 DMA and Calendar Range Lows across many of the indexes and leading sectors puts the markets in a vulnerable position to experience a tipping point that could be triggered by and event seemingly much less significant than the invasion of Iran.
Further weakness is not an opportunity here unless you’re equipped with good risk management tools.
The bull case is still intact and easy to follow. With the bullish narrative still defending the trend, a “good news” break higher that supports the hope that the war will be resolved quickly, accompanied by a collapse in oil prices, would be a good catalyst for a renewed bull trend.
The simple bullish inflection points are the levels defined by these patterns based on the charts’ current locations.
Next week will be interesting!
Want Help?
If you'd like access to the MarketGauge indicators, strategies, automated trading models, and more, contact us.
Best wishes for your trading,
Geoff Bysshe
Co-Founder
(I also post on Linked IN)
 |
 Every week we review the big picture of the market's technical condition as seen through the lens of our Big View data charts. Every week we review the big picture of the market's technical condition as seen through the lens of our Big View data charts.
The bullets provide a quick summary organized by conditions we see as being risk-on, risk-off, or neutral. The video analysis dives deeper. |
Summary: Markets weakened broadly with indexes down 1–4%, deteriorating internals, rising volatility, and nearly all sectors falling as oil and commodities surged amid escalating war concerns and seasonal market weakness. Despite the risk-off environment, growth stocks held up relatively well while gold slipped and the dollar strengthened, suggesting potential short-term mean reversion given deeply oversold conditions.
Neutral
Risk Off
With market internals deteriorating, volatility breaking out, and the risk gauges fully negative, the primary focus should be capital preservation and tactical trading rather than aggressive positioning. Reduce broad market exposure and avoid adding new index longs until markets reclaim key levels or volatility begins to contract.
In the near term, deeply oversold conditions in SPY, DIA, and IWM could produce a short-term mean reversion bounce, so traders can look for tactical long setups if momentum improves, but treat these as short-duration trades rather than trend changes. Technology and communications held up relatively well, so continue to monitor growth stocks for relative strength, with a reclaim of the VUG 200-Day Moving Average ($465.76) serving as an important signal that risk appetite may be returning.
Meanwhile, energy and soft commodities remain the clearest leadership groups, supported by the surge in oil and geopolitical risk, so pullbacks in those areas may offer the most constructive long setups. Until market internals and the new high/new low ratio begin to stabilize, maintain smaller position sizes, tighter stops, and a defensive bias, recognizing that volatility and geopolitical developments could continue to drive sharp market swings.

Every week you'll gain actionable insight with: