January 4, 2026
Weekly Market Outlook
By Geoff Bysshe

The market’s biggest headwind in 2026 may not be what you investors are thinking.
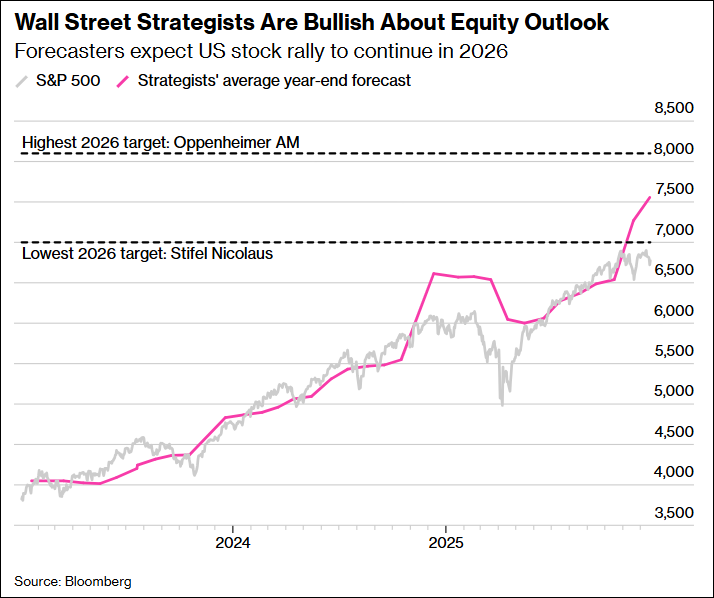
If history is any guide, Wall Street is going to have a very difficult balancing act in 2026—and it’s not between the Bulls and the Bears. In fact, it’s between the Bulls and the Bulls.
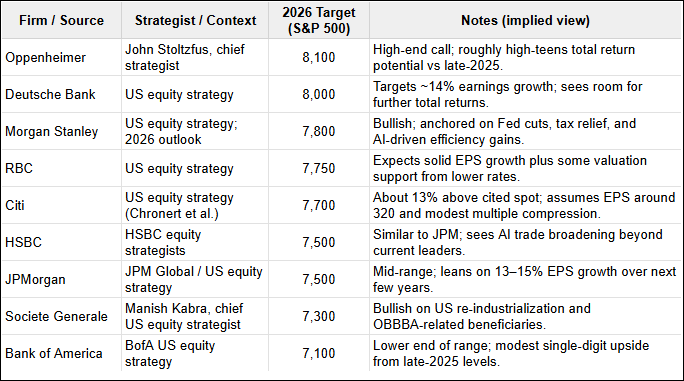
As you can see from the table below, there isn’t a single major bank with a target for the S&P 500 in 2026 that’s lower than where we currently stand at about 6,900.
The market’s biggest headwind in 2026 may not be what you investors are thinking.
If history is any guide, Wall Street is going to have a very difficult balancing act in 2026—and it’s not between the Bulls and the Bears. In fact, it’s between the Bulls and the Bulls.
As you can see from the table below, there isn’t a single major bank with a target for the S&P 500 in 2026 that’s lower than where we currently stand at about 6,900.
With respect to last week’s market outlook, I would not call the current environment a euphoric top, but finding a narrative that will provide an increasingly bullish consensus looks like it will be hard to find.
“Give them a number or a date, but never both.”
- Wall St. strategists’ axiom
In fairness to the Wall Street strategist, their optimism in early 2025 was ultimately proven correct, as we closed significantly higher than their early 2025 targets.
Timing the market is tough. It’s hard to be bullish when everyone else is bearish, but it’s even more difficult to be bullish and correct when everyone else agrees with you.
An easier market forecast in a time like this is that the market will see and increase in volatility. This is Wall Street's way of saying an increase in the number of drawdowns from market highs.
Another outcome, which is already beginning to play out, is that the bull market will continue higher, but there will be significant market rotation.
The first trading day of the year was a clear example of the market rotation that has been underway for some time.
This type of market action is great news for active swing traders, as it can provide many more opportunities to buy your favorite trends on a pullback. And when pullbacks are created by market rotation, they are a healthy characteristic of durable bull markets.
Profiting from Market Rotation
In addition to the balancing act in market sentiment, we’re looking for the market to broaden out and experience more market rotation.
In last week’s Market Outlook, I outlined 5 measures of a healthy bull trend. When you can identify a healthy bull trend, several types of active trading strategies work very well such as:
If you didn’t see last week’s article, I’d recommend taking a few minutes to learn the 5 trends that enable you to find the best bull market trends.
Here’s what happened in the market on Friday that every investor should be focused on, and MarketGauge members should be able to profit from with the MarketGauge Opportunity Framework, explained last week and demonstrated below.
AI Fatigue Will Be The Savvy Investor’s Friend, but Wait For It…
Friday market action should have every MarketGauge follower focuses on two things.
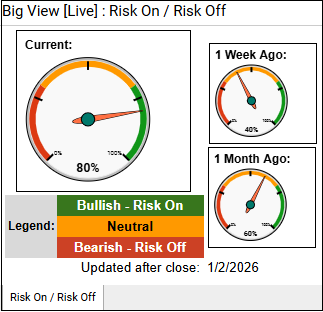
The annotated chart from the front page of our Big View shows how the market signaled a big disagreement about the direction of the trend. It’s also market rotation.
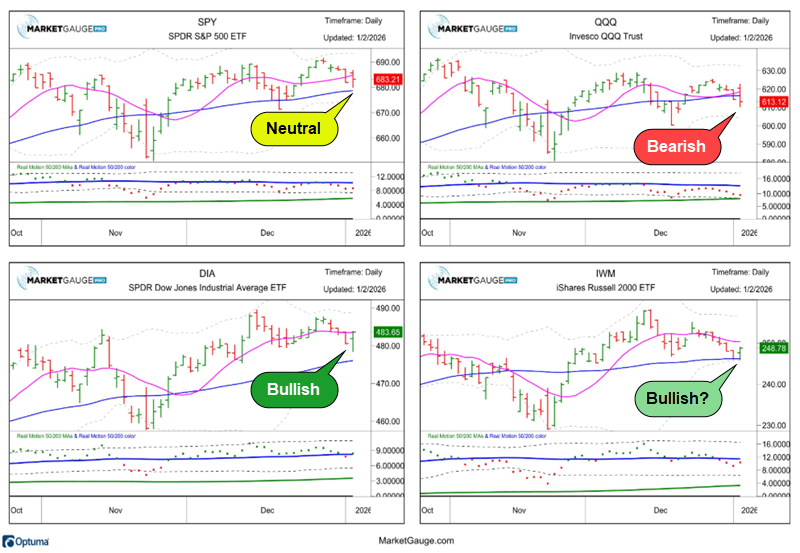
The Nasdaq 100 stocks (big cap tech) got hit while other segments of the market held up and even did well.
In fact, if you look under the hood of the QQQ, there was another big divergence in the performance of the MAG7 and the SMH stocks.
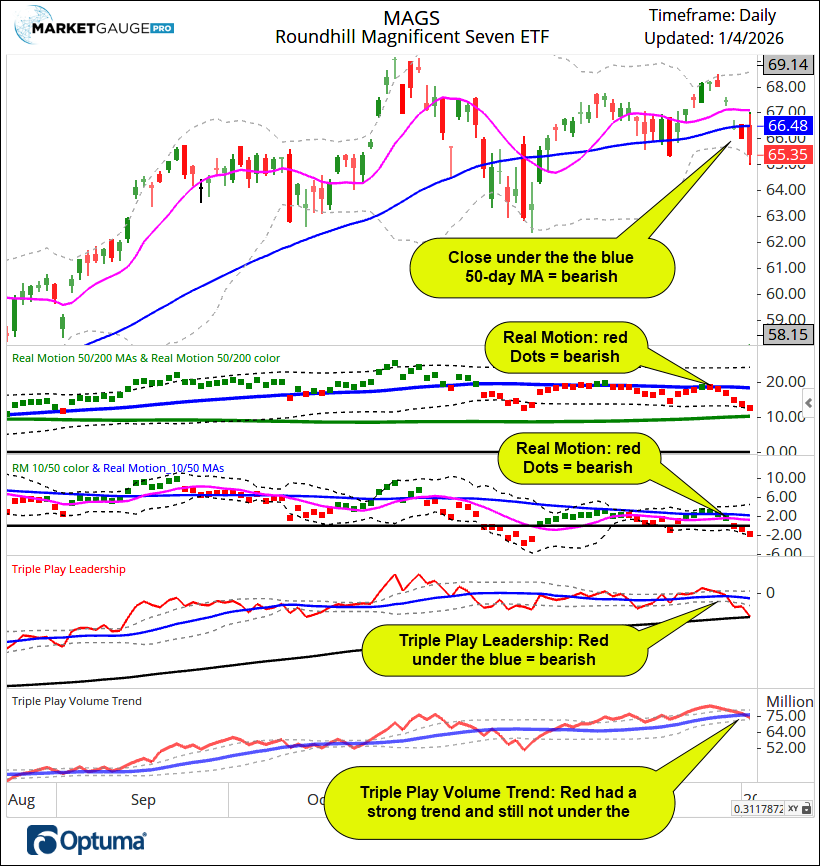
The MAG 7 stocks, as represented by the ETF (MAGS), had a very bearish day (even with NVDA up), while the SMH had a very bullish day.
This divergence and others like it, have been underway for weeks and months. This means that when you can see it happening, you can be ready to capitalize on it, recognize a weak market pullback from a healthy one, and better understand where the best opportunities are in any market conditions.
Below you’ll see the chart of the MAGS contrasted with annotations vs a chart of the SMH.
The comments on the chart all reference the fact that on the day(s) leading up to Friday all but the volume indicator, (4 of the 5) were bearish. As a result, the break of the 50-day MA should have been expected to continue.
The SMH ETF is also composed of large-cap technology stocks, and you would think that it would follow the Magnificent 7 stocks or vice versa.
However, the SMH was in almost the opposite condition as the MAGS ETF (4 of the 5 indicators were BULLISH). See below:
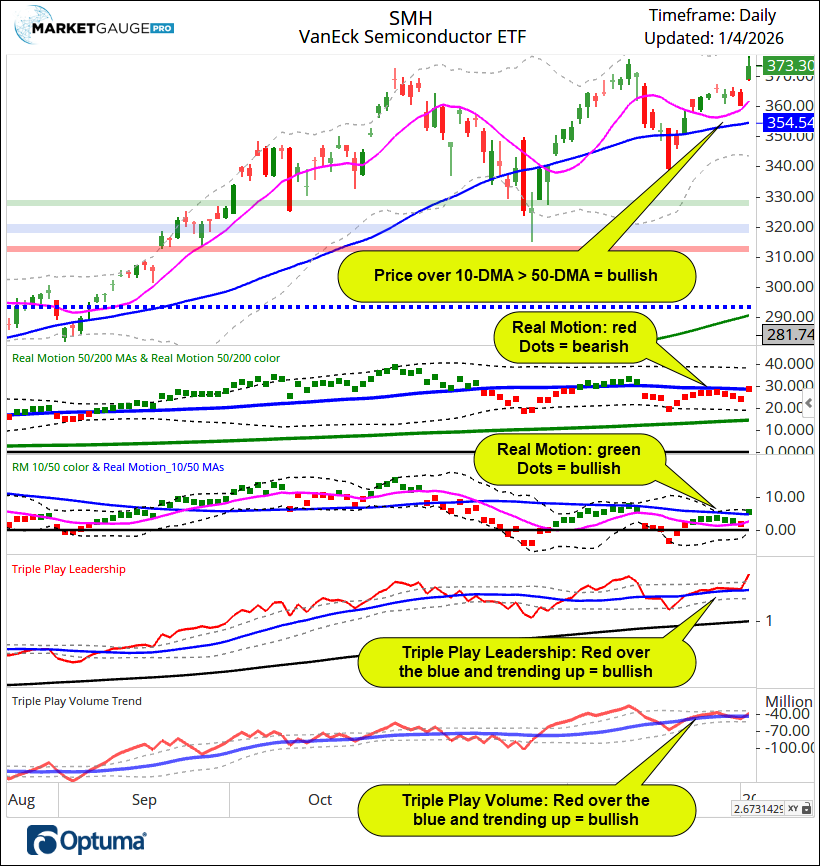
It’s hard to know how a stock will react to the market or news that is not very significant, but it’s not hard to see when a stock's Price Trend, Momentum, Leadership, and Volume Trends are bullish or bearish.
When you can see the condition of these trends, it’s easier to anticipate which way the price trend is likely to go.
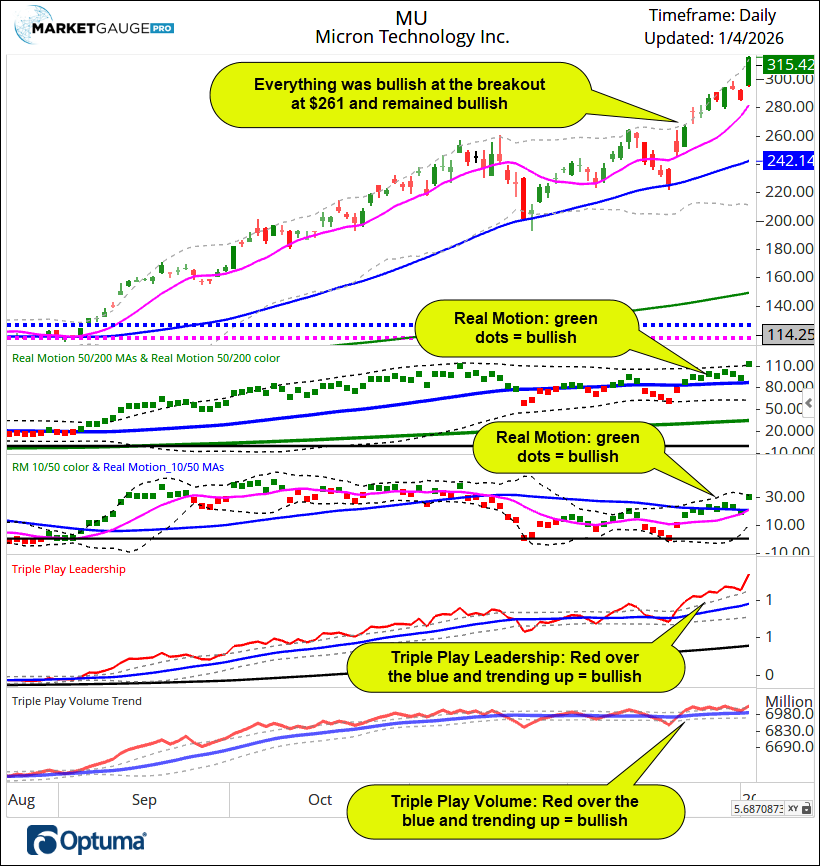
MU Was Clearly Bullish and Ready To Run
As you can see from the chart below, MU, which is in the SMH, was clearly bullish on all 5 indicators (and the narrative is that customers can’t get enough of their chips). So it’s not surprising that once it got off to a good start, it kept going higher.
Earlier in the week, during our Active Investing Edge live-in-the-market mentoring sessions, we reviewed RKLB as a stock with an exciting narrative and very bullish conditions. Check out the chart below and see why I like it.
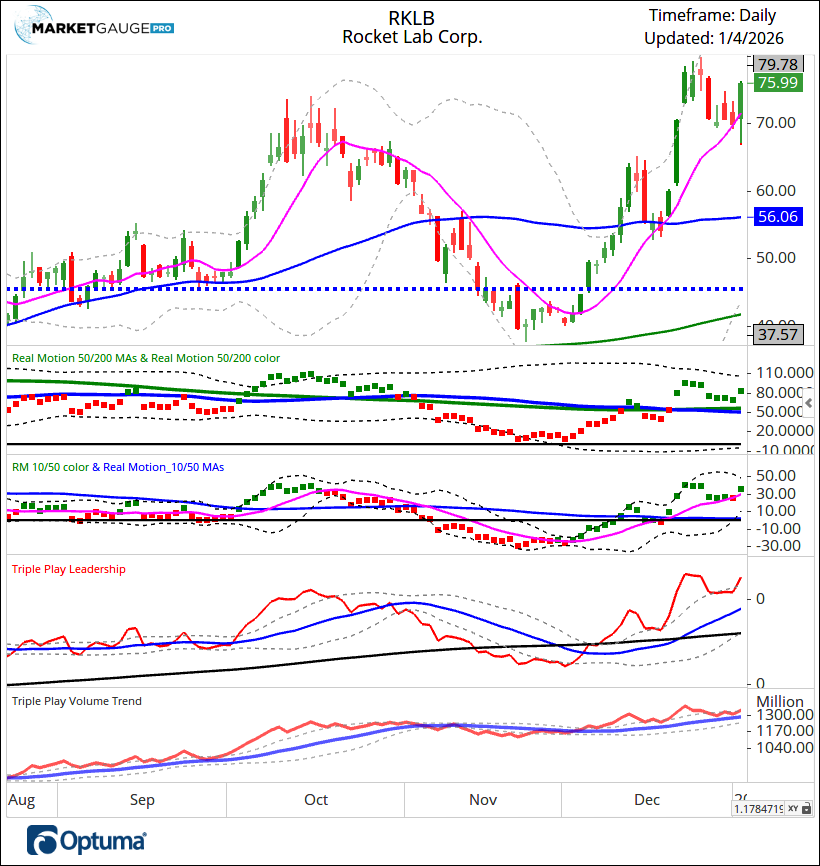
2026 is going to be filled with RKLB like set ups, and they are not all going to be tech stocks. The market has been rotating into several other dynamic sectors, and while the headlines will be telling distracting stories about “AI fatigue and capital overspending,” a new bull market will be thriving.
Don’t miss it. You now know what to look for.
In 2026 there will be hundreds of stocks that move out from the shadows of the MAG 7 mania of the last several years and get “discovered” as their AI-assisted productivity gains lead to increased expectations of growth in future profits, a growing bullish narrative and, as a result, durable bull market trends that build wealth for active and tactical investors.
If you'd like help taking advantage of the new bull market in 2026, contact us.
Best wishes for your trading,
Geoff Bysshe
 |
 Every week we review the big picture of the market's technical condition as seen through the lens of our Big View data charts. Every week we review the big picture of the market's technical condition as seen through the lens of our Big View data charts.
The bullets provide a quick summary organized by conditions we see as being risk-on, risk-off, or neutral. The video analysis dives deeper. |
Summary: Overall conditions remain cautiously risk-on despite a roughly 1% pullback, strong foreign equities, resilient breadth, improving risk gauges, leadership from semiconductors, early crypto strength, and favorable January seasonality continue to support the trend—though momentum is clearly waning. Offsetting this, mixed volume, weakening internals led by Nasdaq, a deteriorating new-high/new-low ratio, growth stocks slipping into a warning phase, and unresolved signals in gold and volatility keep the backdrop fragile rather than decisively bullish.
Risk On
Neutral
Risk Off
Core Bias & Positioning
What to Own / Tilt Toward
What to Reduce / Avoid
Risk Management
Tactical Triggers to Watch
Bottom Line

Every week you'll gain actionable insight with:


