October 26, 2025
Weekly Market Outlook
By Geoff Bysshe

Two weeks ago, on Friday, October 10th, the S&P 500 (SPY) and Nasdaq 100 (QQQ) abruptly dropped from their all-time highs with a vengeance that is not normal. For veteran traders, this could have easily looked like the beginning of something big - and bearish.
However, the very next day, it began a constructively bullish two-week pattern that led to last Friday’s breakout to new highs.
The frustrated bearish investors refrain, “This market just won’t go down,” while the bulls reply, “What do you mean, it did.”
The market pushed to new highs last week for good reasons, and because investors tend to focus on only one (or occasionally two) market-driving themes at a time.
Don’t worry, the market will go down, it eventually does, but something needs to change first. Let’s discuss.
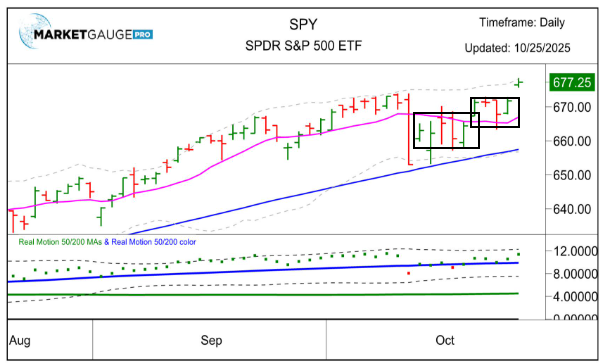
Until last Friday, the SPY and QQQ had spent the last two weeks building a bullish pattern within the range of the “China critical mineral threat” sell off on Friday, Oct 10th.
The two stacked consolidation ranges illustrated by the boxes in the chart below suggested that good news would send the market to new highs.
Friday’s CPI data was the news that got that job done.
The inflation data came in better than expected, which was ideal for the headlines that the market will react to with a bullish breakout to new highs in the short term.
However, the longer-term trends remain concerning, given the stagnant labor market and the Fed's rate cuts.
The question for investors going into the seasonally bullish final two months of the year is whether this concern will fuel the bull market or hold it back.
Tariff headlines will likely create short-term volatility, but the longer-term direction of the market will more likely be driven by the following four trends every active investor should keep tabs on this earnings season.
Why The Market Liked The Inflation Report
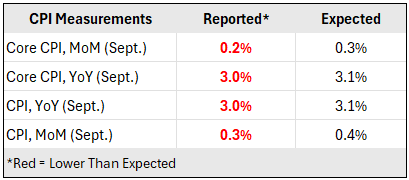
Simply put, the headline measurements all reported numbers were better than expected.
The market’s concern with the Fed’s intention to cut rates is that it will lead to inflation. Lower than expected inflation measures, that are not dangerously declining, are the sweet spot for calming this concern.
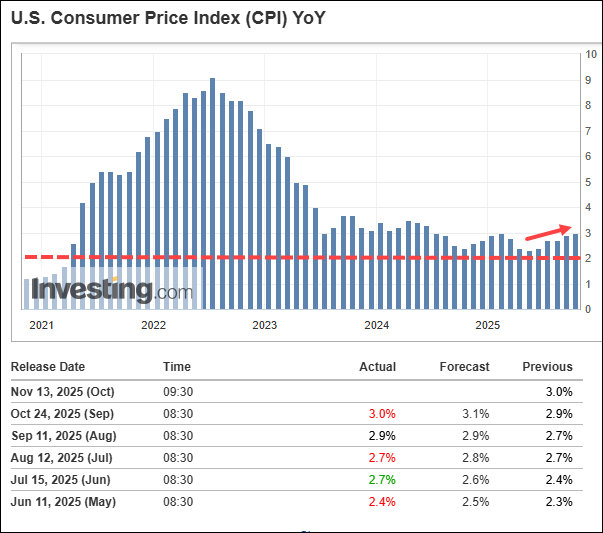
Longer-term, however, the inflation concern is not as simple, but the stock market wasn’t focused on this.
In the chart below, you can see the Year over Year (YoY) level at 3.0% is well over the Fed’s target of 2% and more concerning, the trend has been higher for months.
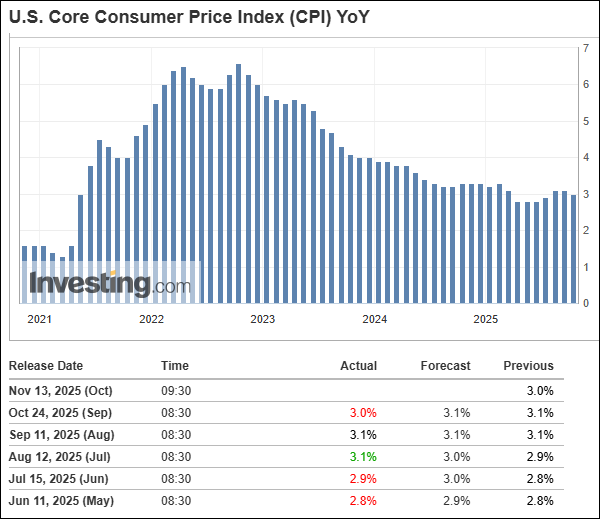
Core CPI shown below isn’t much better.
The next step in analyzing inflation is expectations (for which there are many measures!).
The UMich 1-year expectations are at least trending in the right direction (shown below)
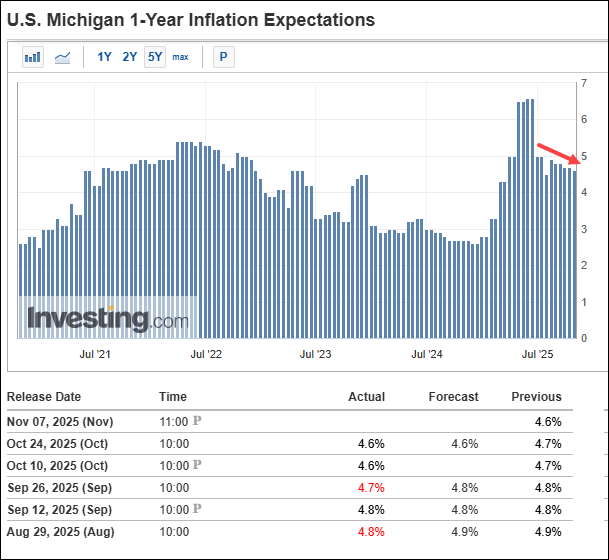
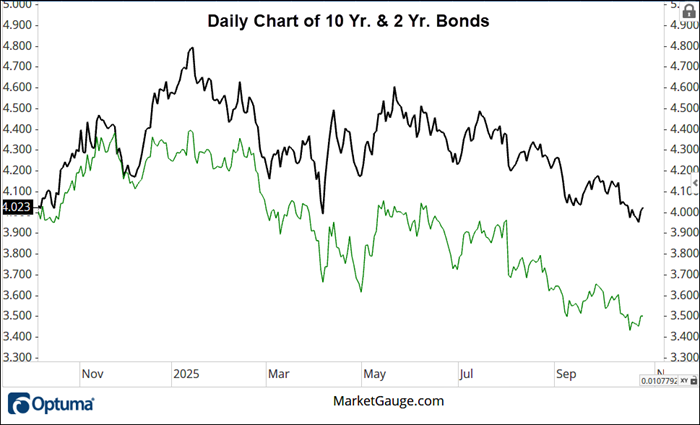
Stocks aren’t focused on the inflation outlook too far into the future right now and unless the bond market reacts to the inflation data, stocks are more concerned with what the Fed will do.
As you can see from the daily chart below, rates in the 2 and 10-year bonds are trending down, and Friday’s data didn’t move them at all.
The Market’s Focus
The driver of the longer-term trend that stocks are focused on right now is earnings growth and as of right now the earnings season is off to a good start.
According to FactSet, 29% of the S&P 500 companies have reported Q3 2025 results, and 87% have reported EPS above estimates. In aggregate, companies are reporting earnings that are 7.6% above estimates. Historically, this is strong, but not exceptional.
In terms of revenues, 83% of S&P 500 companies have reported revenues above estimates, While it’s still early in the season, in aggregate, companies are reporting revenues that are 2.4% above the estimates, which is above the 5-year average of 2.1% and above the 10-year average of 1.4%. This outperformance is notably stronger than the profit numbers.
This leads to the question – what’s happening to margins?
This article isn’t going to focus on the tariff impact on earnings, but this chart from FactSet is worth paying attention to as earning season progresses and into next year.
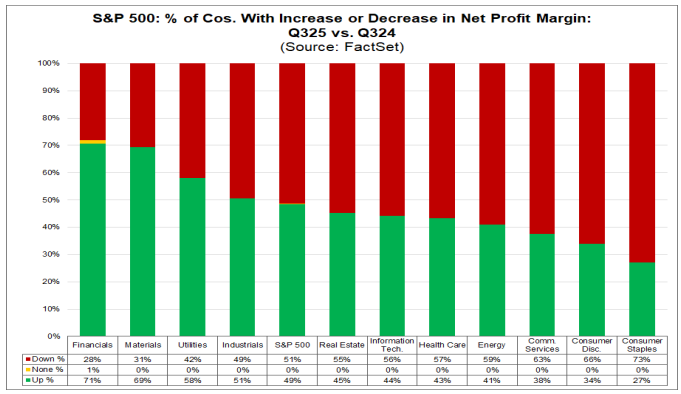
In general, for all the S&P 500, 50% of companies have seen a decrease in margins.
The most important insight from this chart, however, is that the industries experiencing the biggest margin hit are those most likely to be affected by tariffs.
Contrary to what the administration likes to say, tariffs are paid by the American company that’s importing the goods being tariffed. So unless the American company can get the foreign company to lower their prices to cover the cost of the tariff, the cost of the tariff falls on the U.S. company.
If U.S. companies that are subject to tariffs don’t raise prices (which is inflationary) then they will see their margins decline.
Currently, the market appears to be watching margins closely but ultimately judging companies on how they manage their bottom lines and report EPS relative to expectations. This is easier to do when revenues are rising.
This “market message” is that stocks that beat their estimates have seen their stock prices rise.
The warning sign that margins are a serious bearish concern will come when the trend emerges in which companies that beat on EPS but have lower margins sell off.
One way for companies to mitigate this uncomfortable margin pressure from input costs is to cut costs elsewhere – think labor costs.
How Long Can The Good Times Roll?
Even the bulls are constantly asking this question.
Again, it’s still early in the earnings season (only 29% of the S&P 500 have reported), but corporations are bullish, as you can see from the chart below showing the number of companies raising vs. lowering guidance.
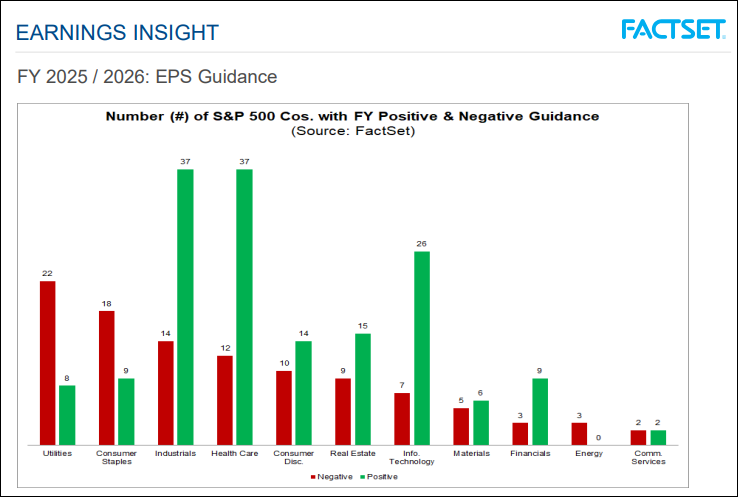
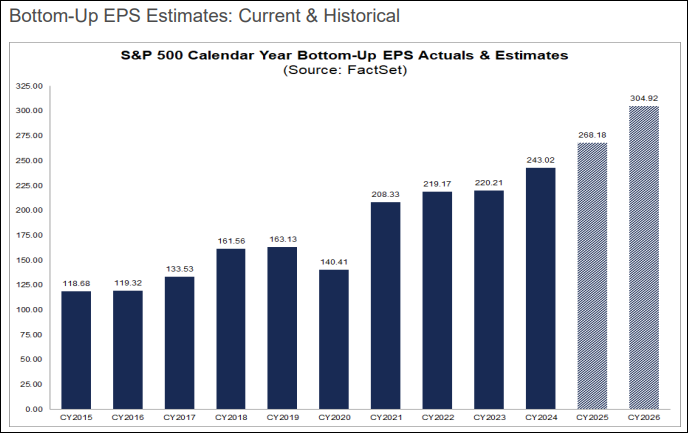
Analysts also see earnings growing into 2026, as shown in the chart below.
WARNING: Consider The Source of The Data
As mentioned several times, the earnings season is just getting started, and the source of all the earnings data above is the S&P 500 companies. While these are the biggest drivers of the most popular market index, they are not always in alignment with the small and midcap stocks.
Next week we’ll look at the broader market which doesn’t have the same level of strength in its earnings trend.
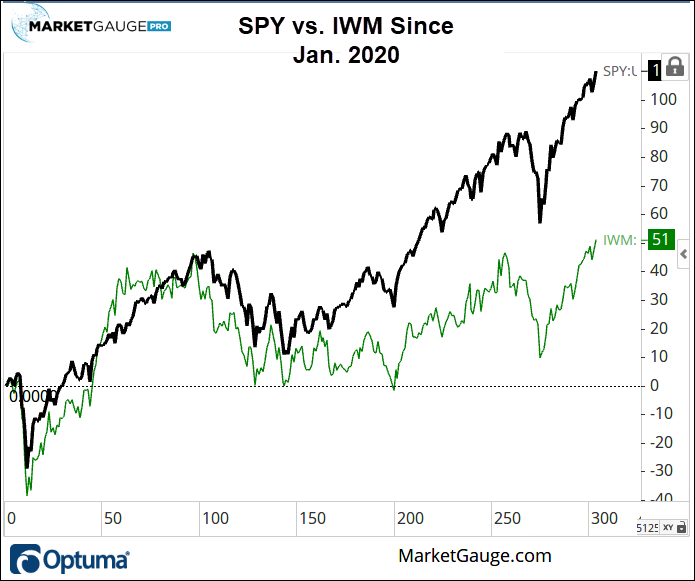
This broader market weakness has been reflected in the IWM’s underperformance relative to the SPY for years as shown below.
The big question for the bull market is, will the earnings and stock performance improve in the smaller stocks. As you can also see in the chart below. The IWM is back to all-time highs for the first time in a long time.
Why The Market Won’t Go Down
As I said above, don’t worry: the market will go down by more than a few percentage points someday.
Here are two ways it is most likely to happen and how to see it coming.
Bear Market #1 – A Crash
Yes, there could be a very sudden liquidity-driven collapse driven by a sudden shift in sentiment, combined with a lack of buying liquidity to support a panic-like dumping of risk assets. This is typically referred to as a black swan event.
By definition, black swan events are not supposed to be “predictable,” yet it’s a popular game in the media. It’s an expensive game to play if you’re looking to build wealth over time because you’re opportunity cost is enormous when you’re too early.
If you’re in the camp of “the black swan event is coming”, I won’t try to change your mind. Eventually, you’ll be right. I will suggest, however, that the largest negative moves in the stock market don’t begin within a few percentage points of the all-time high.
There are stages in every bear market, including ones that have crashes. We covered this concept specifically in the “But What If There’s A Crash” section of the Sept 21st edition of Market Outlook.
Risk management that adapts to changing market conditions is a way to reduce exposure to a crash scenario without having to play the game of predicting a crash while the market continues to make new highs.
Bear Market #2 – The Good Old Earnings Recession
More likely than a black swan event, the market will, over a longer period of time than the lead time up to a black swan event, turn its typically singularly focused attention to the fearful prospect of earnings growth slowing substantially.
There could be many different reasons for this fear of slowing profit growth becoming the market's focus.
The media will focus on these reasons and describe them as “things look bad.” Unfortunately, that’s same thing we hear from the media now. Portfolio managers and market strategists highlighted in the media are paid to highlight risks and talk about the dangers and that’s what attracts attention for the media.
Counterintuitively, the constant drone of bearish sentiment is more often bullish than bearish, so don’t ignore it!
As we often say here, understand the bear’s argument, and listed to the market’s message as spoken through price action. If the market agrees with the bears, it’s time to take notice.
If the market is also reflecting credible evidence that corporate profit growth is expected to decline, it’s time to prepare for the much-anticipated market declines.
Applying the insights of the two “base case” scenarios above is easier said than done, but you can do it with practice and humble discipline.
You’re In The Driver's Seat, and…
You’ve Got Access To More Than Those Old AAA Fold-Up Paper Maps!
For 40 years, I’ve studied the way markets react to news, data, chart patterns and changes in institutional and retail trading technologies.
While everything changes, the lesson from history that consistently repeats is that the market sends a message that warns and informs the investor who listens.
The objective of this weekly article is to share ways to improve market insight through the market’s messages so that you can feel more confident about your understanding of the stock market and make better decisions about how to build your wealth with it.
Both scenarios can be managed through either self-directed discretionary trading or selecting the right asset manager to do it for you. Ultimately, in both situations, you’re in the driver's seat.
If you’d like more help, you have several options…
Best wishes for your trading,
Geoff
 |
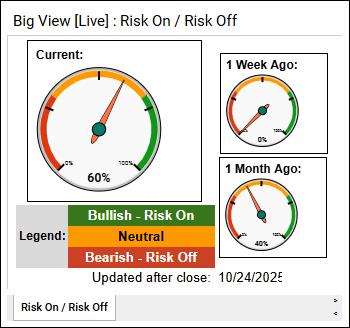 Every week we review the big picture of the market's technical condition as seen through the lens of our Big View data charts. Every week we review the big picture of the market's technical condition as seen through the lens of our Big View data charts.
The bullets provide a quick summary organized by conditions we see as being risk-on, risk-off, or neutral. The video analysis dives deeper. |
Market Summary
Markets extended their rally with major indexes hitting new all-time highs, strong momentum across sectors, improving internals, and confirming risk-on signals from volatility and global equities. However, the lack of accumulation days, mixed Economic Modern Family readings, and neutral intermarket signals from commodities, the dollar, and Bitcoin suggest underlying strength tempered by selective caution.
Risk On
Neutral
Market Context
Momentum remains strong and broad-based with multiple indexes at new highs, positive internals (McClellan, NH/NL slopes, Real Motion), and volatility confirming a risk-on regime. Seasonality into November provides a supportive backdrop, though lack of accumulation days and mixed Economic Modern Family readings warrant measured exposure increases rather than full risk allocation.
Equity Positioning
Sector & Thematic Rotations
Global & Intermarket Positioning
Risk Management

Every week you'll gain actionable insight with:


