June 4, 2023
Weekly Market Outlook
By Keith Schneider
Hello Gaugers. Hope you had a good and profitable week as the market continued grinding higher. As we will review some of the bright spots, areas to be aware of, and June prognostications, we first want to discuss what the impetus may have been for a strong rally this past Thursday-Friday.
After starting out this holiday-shortened week on Tuesday and Wednesday with ongoing pressure of the Debt Ceiling, the week’s new news, interest rate moves, and the betting pool all but confirmed that the economy was staying strong and we would likely see continued rate hikes at the upcoming Fed meeting in June and perhaps even in July.
Inflation numbers have been persistent and higher than expected. Something we have written about recently and gone over in detail. If you did not read last week’s Market Outlook, you can find it here.
The betting odds for a rate increase in June were above 50% in the past few weeks. The debate over suspending rate increases or hiking yet again later this month has remained intense. There is an ongoing argument, even amongst Fed Governors, about whether to defend a pause or “skip” a rate increase when they meet on June 13-14.
If they were to do so, that would stop a streak of 10 consecutive rate hikes that have raised the Fed’s benchmark lending rate to a range of 5-5.25%, the highest level in more than 15 years.
Some Federal Reserve officials are suggesting that a PAUSE, would allow them to assess the impacts of their aggressive rate-hiking campaign over the past 15 months. Their comments belie that such factors as slowing economic activity, tougher lending standards, and the lagging effect of tighter monetary policy need to be evaluated and that a PAUSE (not skip) is warranted.
This week two such Fed Governors, Philip Johnson and Patrick Harker came out to support the PAUSE.
“A decision to hold our policy rate constant at a coming meeting should not be interpreted to mean that we have reached the peak rate for this cycle,” said Federal Reserve Governor Philip Jefferson at a conference in Washington, DC, this week. “Indeed, skipping a rate hike at a coming meeting would allow the Committee to see more data before making decisions about the extent of additional policy firming.”
Federal Reserve Bank of Philadelphia President Patrick Harker echoed Jefferson’s view this week in suggesting that it would be appropriate to vote for a PAUSE in June because of factors that are starting to weigh on the economy.
“I do believe that we are close to the point where we can hold rates in place and let monetary policy do its work to bring inflation back to the target in a timely manner,” Harker said Thursday during a moderated virtual discussion hosted by the National Association for Business Economics. “We should at least skip this meeting in terms of an increase. We can let some of these things resolve themselves, at least to the extent they can, before we consider - at all - another increase.”
Still, other officials are wary about suspending any rate hikes and believe that inflation and the economy are still running hot and they need to continue pushing on the brakes. Therefore, these officials want to see additional hikes to prevent inflation from beginning its ascent.
The stock market rallied Thursday due to comments by these Fed officials and the idea that a PAUSE was in the offing.
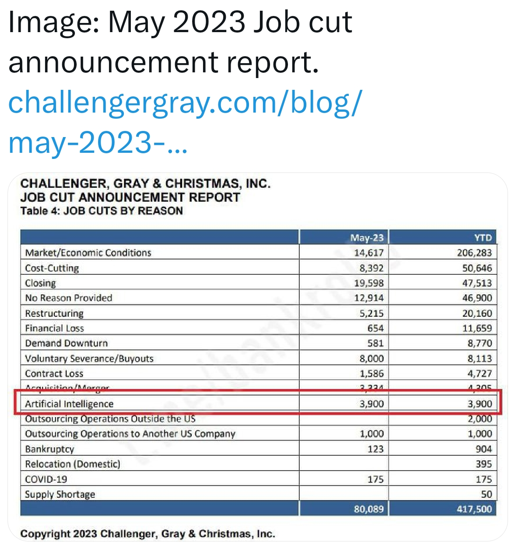
Friday, the Jobs report with an unexpected 330,000 jobs created in May (190,000 expected) should have cast doubt that there would be a PAUSE at the upcoming meeting. However, looking further into the report, the unemployment rate ticked up to 3.7% and showed that layoffs are continuing.
More importantly, for the first time, layoffs of 3900 people due to AI beginning to be utilized by major corporations to replace workers, gave the market something to cheer about. The PAUSE was back on the table. For the moment, it appears that the Fed may be engineering a ‘SOFT LANDING” and that we are seeing a bifurcated economy that shows growth while also experiencing higher unemployment, which may eventually cool the job market and slow down the economy. See the layoff report that sparked a huge rally on Wall Street Friday:
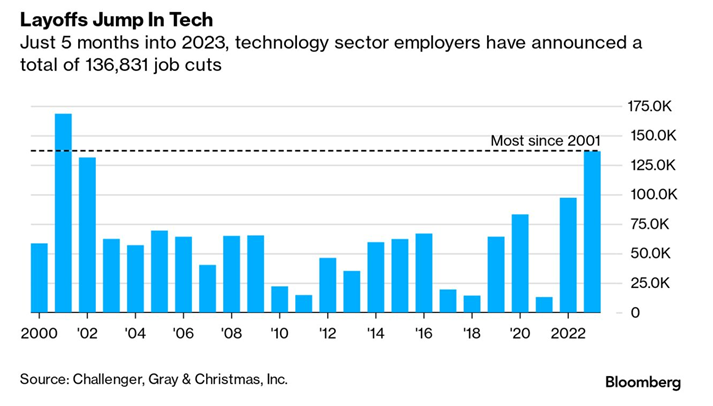
Also, given that the technology industry continues to run profitably, is flush with cash, and can extract new technologies (AI) to increase productivity, it has attracted much of the investor capital these past 5 months. This chart shows how tech companies continue to perform well and be able to reduce their overhead while doing so. See graph below:
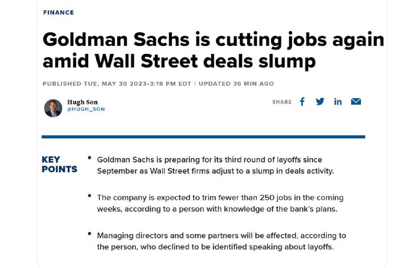
Other profitable industries are participating in job layoffs and reducing their costly overhead. Goldman Sachs, among other large investment banks and financial entities, continues to reduce staff. See image below:
It’s still possible that the Fed could hike rates later this month, mostly if the latest Consumer Price Index to be released on the first day of the Fed’s two-day policy meeting shows that inflation accelerated in May. Some officials have expressed concern recently that inflationary pressures persist — but it seems like those with a dovish approach have built a strong case for a pause.
Better Market Participation This Week.
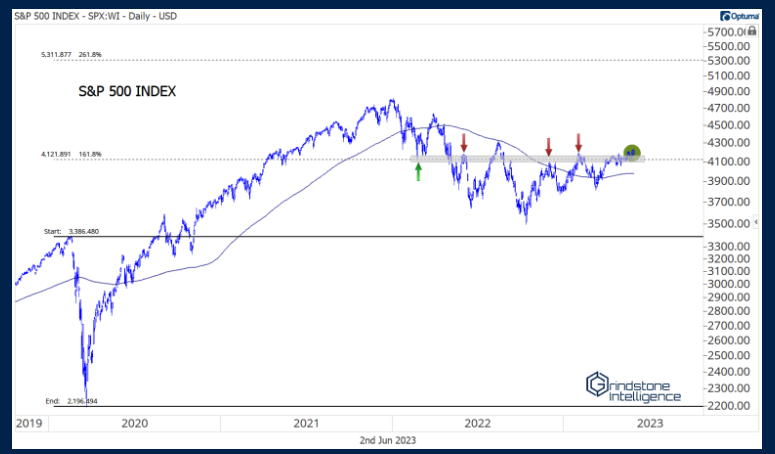
We commented last week about the terrible breadth of the market. With the potential PAUSE on the table and additional weakness showing up in areas of the economy (we will cover shortly), the market took off this week to new YTD highs and broke above resistance. First, it was the tech heavy NASDAQ Composite, which did so earlier in the year. This week the S&P 500 followed suit this week. See charts below:

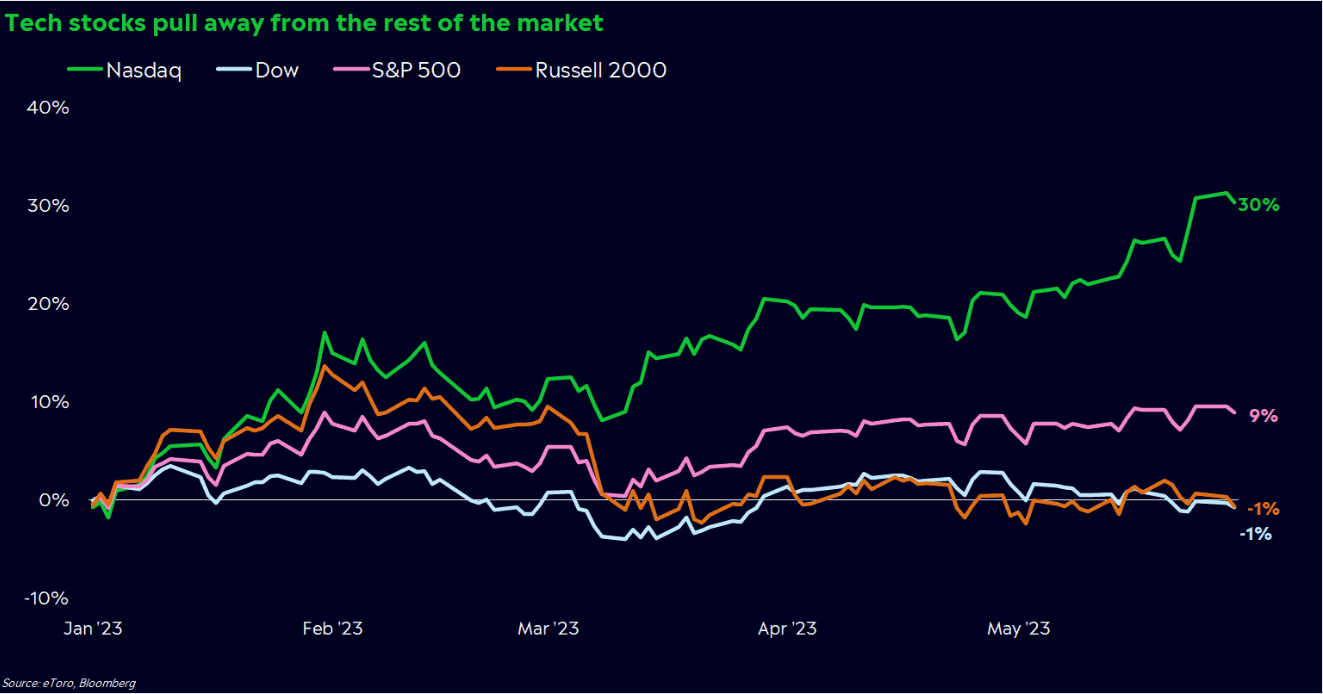
After a significant rally in the market this past Friday, we finally saw the value tilted Dow Jones Industrial Average (DIA) and the Russell 2000, the smallest cap stocks (IWM) participate, and many investors are wondering if this is the start of playing “catch-up.” As you are well aware, these indices have gone nowhere this year and are basically flat for 2023. See chart showing the 4 major averages through this week:
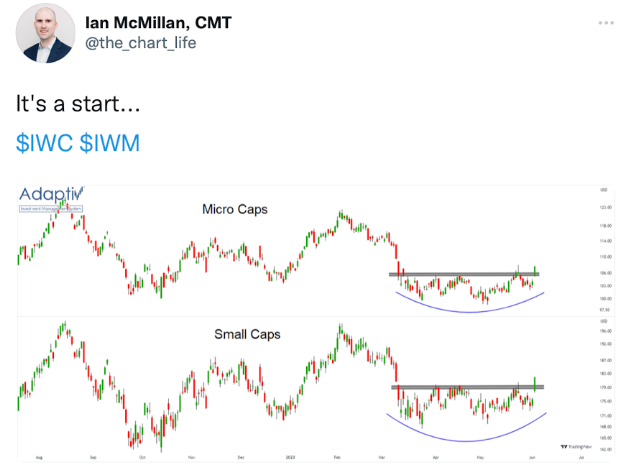
With the non-participation of micro and small-cap stocks, many people believe that the markets cannot be driven ONLY by large-cap tech. With this new move by the smaller companies, this may be a positive sign for stocks in the months ahead. See chart below:
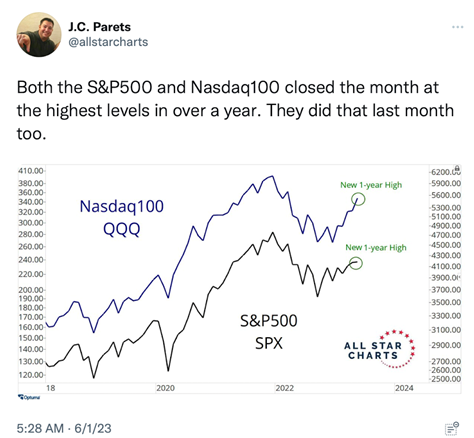
The S&P 500 and the NASDAQ 100 closed at the highest level in one year. This is a big Positive for the markets:
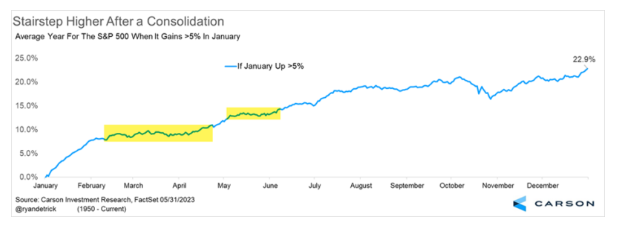
The market continues to grind higher. It also has a good chance of continuing this climb. You may recall that back in February, we shared with you that when the market is up greater than 5% in January, it has a propensity to move higher the remainder of the year. See chart below:
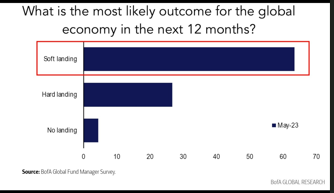
Many of the investors who are participating in this market “grind higher” or have taken advantage of positioning in tech stocks which are leading the way, believe a soft landing is possible. See survey chart below:
Some cautionary charts and areas to be aware of:
We wanted to provide a fair and balanced view of the positives and negatives that continue to overshadow our markets. It is important to note that inflation remains high, debt is high, interest rates and lending remain very restrictive, and the Fed is draining liquidity from the system.
These factors and others will continue to apply downward pressure on the capital markets, and you should remain vigilant and aware that these issues are there. We remain cautious as do many of our algorithms and investment strategies and All Weather Blends.
Here are a few troublesome illustrations:
Huge numbers of investors (including institutional investors) are still not participating in this market’s grind up. Significant assets (over $5 trillion) continue to sit on the sidelines in money market funds and short-term securities. A good chart showing investor sentiment readings follows:

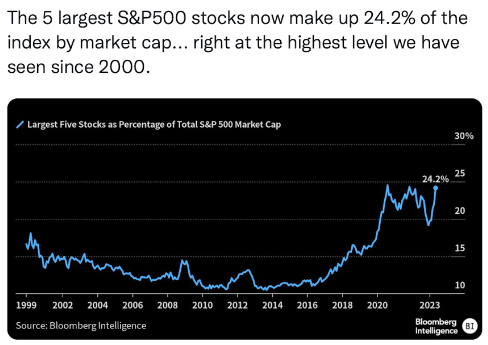
Even with the better participation of small caps and some value stocks that make up the Dow, the true fact is that fewer large capitalization stocks are driving this market higher. We have not seen this % of stocks having that effect since 2000 and we all know what happened from mid 2000-2001. See chart below:
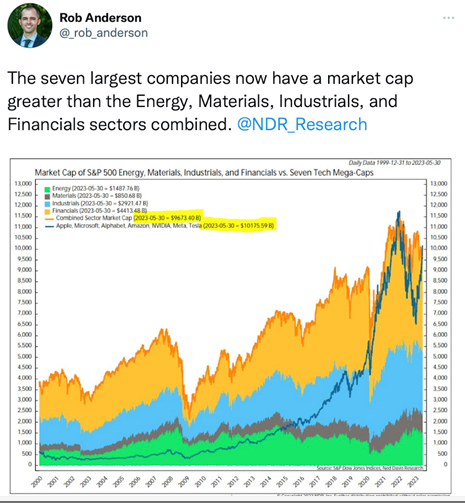
The 7 largest companies are now dominating the economy which is unbalanced. See an interesting chart about this phenomenon:
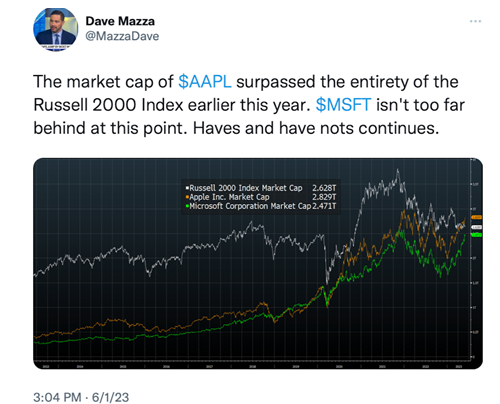
To put this in perspective, the market cap of Apple alone is greater than the total value of the 2,000 stocks that make up the Russell 2000 index. Microsoft will soon be greater as well. See below:
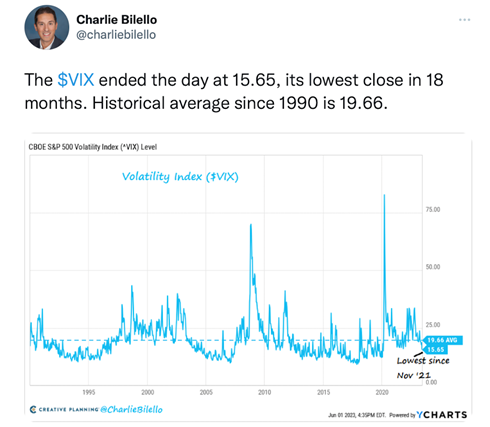
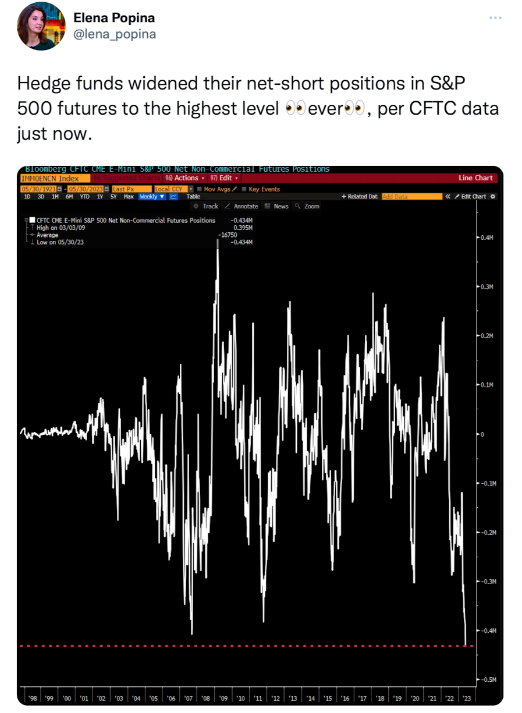
Hedge funds and sophisticated large institutional investors keep putting on S&P 500 shorts. With the volatility index at its lowest reading (see below) in over 18 months (before the markets unwound in 2022), many large investors are taking advantage of lower costs for portfolio protection and are putting on short positions in enormous numbers. See charts below:
Why would they do this? Here are some economic indicators that we follow (courtesy of Game of Trades) that sum up the troubling economic scenario many believe is unfolding.
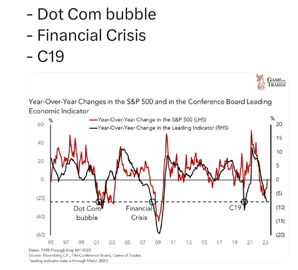
Leading Economic Indicators (LEI) point to much more than a “soft landing.”
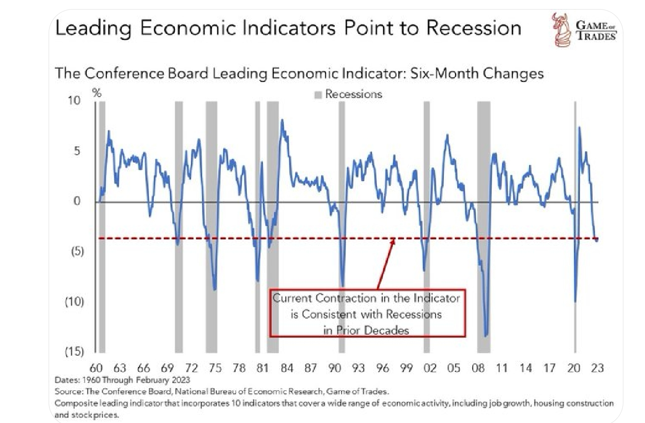
The stock market tends to follow the Conference Board and Leading Economic Indicators up or down. These numbers, as shown above, are trending down. Will the market follow?
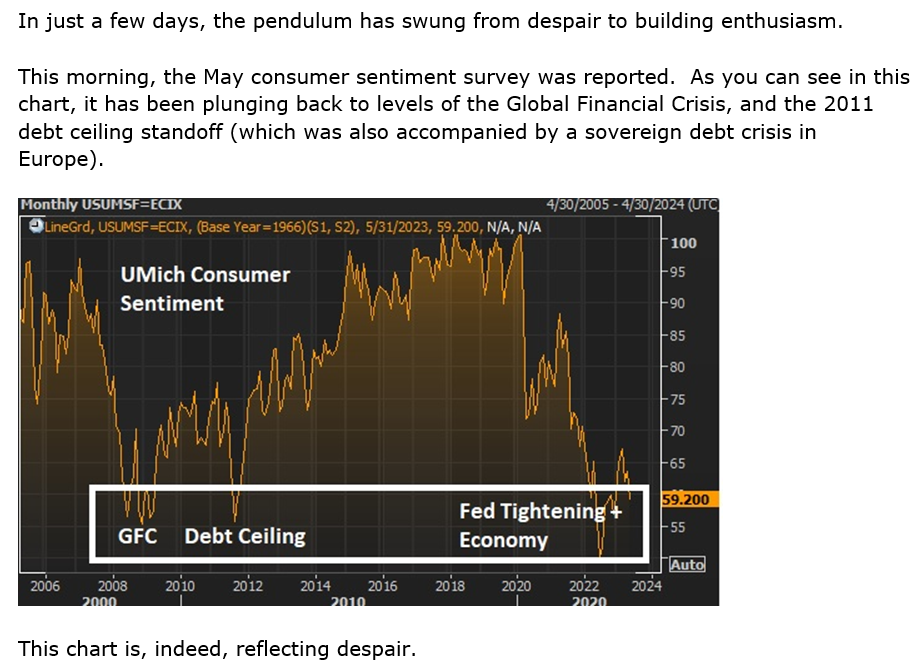
Consumer sentiment, as reported by the University of Michigan recently, was not good. See the following chart:
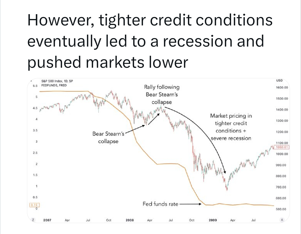
Lehman Brothers and Bear Stearns went bankrupt in March, 2008. We were at the beginning of the financial crisis which persisted for more than a year and took many years to recover from. However, after the Fed came to the rescue of Lehman and Bear Stearns, the market rallied for 3 months thereafter before plunging into a severe bear market. Many think that this is what is currently occurring given the Fed (and Treasury Department) trying to resolve a similar situation with the regional banks that blew up a few short months ago. See chart below:
How to have less REGRETS:
A SMART WAY TO INVEST
Don’t be in the regret business. How? Either follow our investment strategies or let our affiliate regulated entity, Market Gauge Asset Management, do it for you.
We have been working on enhancing several of our investment strategies and the All Weather Blends incorporating the S.M.A.R.T. investment technology (“SIT”) which we have developed and are fully implementing into our blended approach to investing for our customers.
S.M.A.R.T. is Separately Managed Asset Reallocation Trading. It employs the following attributes to provide a smoother investment experience with a higher positive outcome. The major factors that summarize the SMART investment technology are as follows:
(you may not be aware of several of the profitable targets we recently took off in a number of our investment strategies, thereby locking in significant short-term gains and reducing the overall portfolio risk from giving back these profits)
We would love to share with you our All Weather Blends as well as help you understand how/why each investment strategy works and how you can easily follow along with us. We can also help execute the strategies and blends for your portfolio(s). Reach out to [email protected], [email protected] or myself, [email protected] if you would like more information.

Risk-On
Risk-Off
Neutral

Every week you'll gain actionable insight with:


