December 10, 2015
Mish's Daily
By Mish Schneider
Remember the now famous line from the film The Sixth Sense, “I see dead people?”
I sort of feel that way looking at certain instruments that are arising from the dead. In other words, “I see dead ETFs.”
Of course I use the word “see” loosely in that these aren’t psychic images like the ones we think the boy” sees” in the film. Spoiler Alert: In the film, we find out that the boy is psychic, and he does indeed “see” dead people.
I am also very much alive but take full creative license in writing what I see in these terms. What constitutes “seeing” something dead and then “seeing” it alive is not that elusive.
We at MarketGauge, use several rules that are both teachable and repeatable. We pride ourselves on that. Furthermore, we incorporate rules for position sizing, timing entries and calculating profit targets/trailing stops.
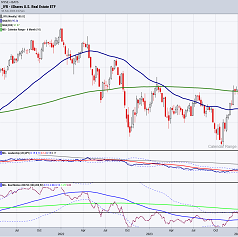
I have yet to replace my burnt out monitor (speaking of dead) that houses the 6 ETFs I am focused on any given day. One of those ETFs is the S&P Oil and Gas Exploration (XOP).
Having been in a bear phase since October 2014, I think most would agree that XOP has been “dead.” What I wrote Tuesday, “Oil and Gas Exploration (XOP) may have found some footing along with the other ETFs in the oil and energy space,” did that come from a Sixth Sense?
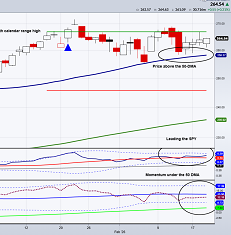
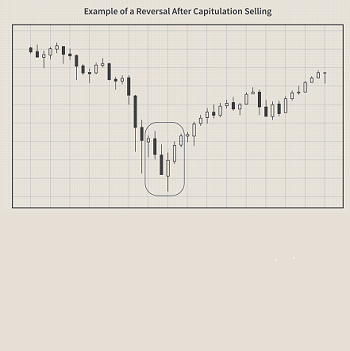
Would be fun to say yes, but not at all accurate. It came from 2 very distinct patterns. First, the classic reversal pattern when an instrument makes a new 60 plus day low, closes in the top 25% of the intraday high and does so on better than the average daily volume.
Secondly, Bear or Bull Phases long in the tooth often, way before the reversal pattern, give us another sign.
As we look at six different market phases, a high percentage and significant indication that a trend could reverse is when the phases change often between a Bear and Recovery for reversal buys. For reversal shorts, it is when the phases change several times between a Bull and Warning phase.
XOP is a classic “dead” ETF coming to life example as it closed Wednesday up 1.75%.
That is one of the topics I will cover on Phases later this evening in our free webinar, How To Catch Big Swing Trades Using 'Market Phases'
I will also cover the Economic Modern Family and the phases each member is in plus illustrate the aforementioned rules we use to time our way in and out of trade with the proper position sizing.
Hope to meet you later!
S&P 500 (SPY) Inside day closing on the 50 DMA. We either see 208 or 202 soon enough Subscribers: Positive Pivots in all except IWM
Russell 2000 (IWM) Inside day in the bear phase. 118 gives it new life and 112 should be support
Dow (DIA) Inside day but actually recaptured the 200 DMA. Now has to clear 178 of under 174 see 171.60
Nasdaq (QQQ) Inside day. 111.35 or 114.50-which will come first?
Volatility Index (VIX) Confirmed phase change to Recovery
XLF (Financials) Confirmed phase change to bearish with support at 23.80 to hold
KRE (Regional Banks) Holding the 200 DMA marginally so has to move up over 43.50 to get enough away
SMH (Semiconductors) Inside day. Another range to watch 55.85 to 54.20
IYT (Transportation) More like a dead cat bounce than a reversal of any consequence
IBB (Biotechnology) 2 Inside days. Range break will be very telling
XRT (Retail) Interesting inverted doji candle Tuesday followed by an inside day Wednesday. Want to see it hold 43.68 or more trouble
IYR (Real Estate) Wedged between the 200 and the 100 DMA. Still not that bad looking a chart if holds around 72 down below
ITB (US Home Construction) Back below the moving averages with express train to a Distribution phase
GLD (Gold Trust) Over 104 is something, otherwise, not very clear
GDX (Gold Miners) Over 15 much better
USO (US Oil Fund) I got nothing til I see a dead “ETF” awakening
XLE (Energy) Big volume or second day of Accumulation
XOP (Oil and Gas Exploration) Should hold 32.40 area and clear 33.79
TAN (Guggenheim Solar Energy) Another big day of volume-like to see it move over 27.50 again
TLT (iShares 20+ Year Treasuries) Over 122 will look like that flight to safety. Under 120.50 not so much
UUP (Dollar Bull) Cleared from the 3 moving averages-moment of truth on the strength of weakness going forward
GREK (Greece) Possible reversal with some volume-watching

Every day you'll be prepared to trade with: