April 25, 2016
Mish's Daily
By Mish Schneider
Back in early December 2015, I wrote a piece on the Hemline Theory. According to the theory, hemlines below the knee indicate a falling stock market.
I first noticed the longer length of women’s dresses and skirts in the September 2015 Vogue. Today, I received my May 2016 issue.

In the section called “Moment of the Month,” the skirt above is featured. Typically, the sociological reason for declining hemlines as related to a declining stock market is because women become more conservative. Back in the day, the reason was more practical-women could not afford stockings.
Perhaps the most fascinating difference presently, is that this longer skirt has pleats. Pleats, according to Vogue, “aim to put a playful dent in your wardrobe.”
Does that mean if longer skirts equal an uncertain social mood, adding pleats suggests compensation?
In Dr. John Casti’s book “Mood Matters: From Rising Skirt Lengths to the Collapse of World Powers”, Casti writes that, “the rise and fall of great civilizations are biased by the attitudes a society holds to the future"
Doubtful Dr. Casti mentions pleats. However, I wonder if what he writes is true, how do adding pleats modify that statement?
To me, if falling hemlines broadcast a “dour” mood, pleats say not so fast.
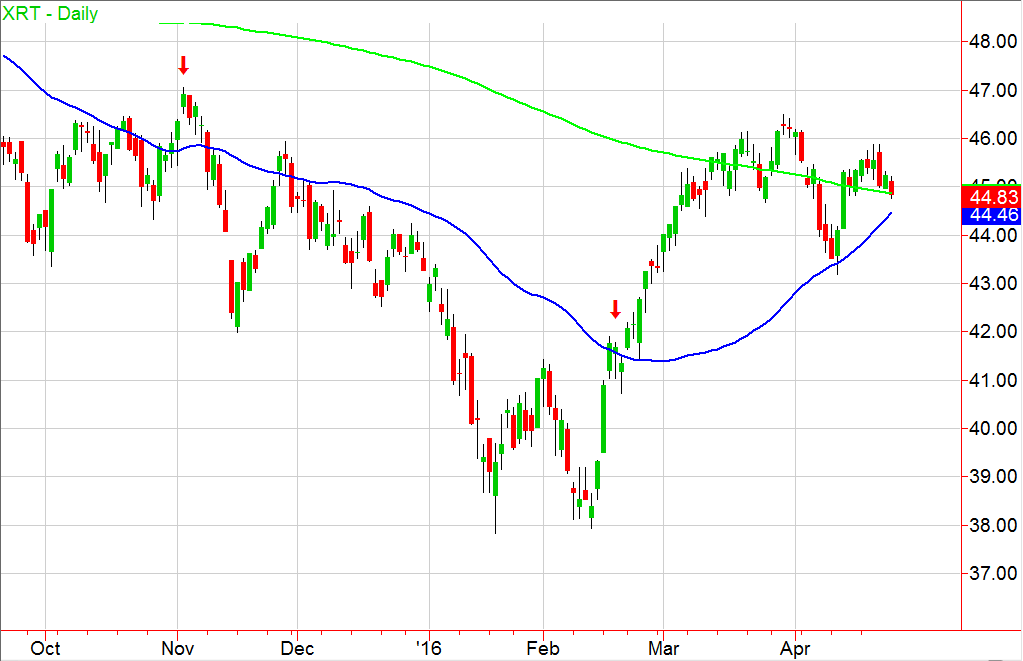
The daily chart showing XRT, the ETF for Retail illustrates perfectly.
Clearly, if one had shorted the market in September, the hemline theory looks miraculous. Once the bottom (and a clean double bottom at that) hit in February, fashion designers must have been busily sketching out pleats. The mood of the market clearly shifted.
The rising blue 50 daily moving average looks poised to cross back over the green 200 daily moving average. That is, if we do not have a sharp correction below 44.00.
Even with today’s selloff, XRT is close to the 50 DMA support and not too far from recapturing the 200 DMA.
No doubt shopping trends and consumer habits are a harbinger of how the economy fares. That’s why the Retail sector ETF is the Matriarch of my Economic Modern Family.
As for the rest of the family, they too seem to be more in digestion mode. Granny’s partner, the Russell 2000 retreated from the weekly moving average but thus far, holds key support.
According to Vogue, long pleated skirts are “accordion-like, both fluttering and flattering.” A fair enough description of today’s market’s action.
S&P 500 (SPY) 206.84 point to hold. December high 211. Held the 10 DMA and had a Golden Cross
Russell 2000 (IWM) 112.25 the 200 DMA to hold. The 50 week moving average to clear is 114.40
Dow (DIA) Closed just shy of 18k but certainly does not reflect terror.
Nasdaq (QQQ) 107.85 the 200 DMA held with an inside day
XLF (Financials) 23.25 the 200 DMA and good digestion day
KRE (Regional Banks) Back under the 200 DMA for an unconfirmed recovery phase. Not reading much into that unless it confirms
SMH (Semiconductors) 54.00 pivotal
IYT (Transportation) Needs to clear 148 hold 140
IBB (Biotechnology) Inside day above the 100 DMA
XRT (Retail) Closed on the 200 DMA. 45.60 the weekly MA to clear
IYR (Real Estate) Performed better than I expected. Over 77.40 should continue up again. Otherwise, could see 75
ITB (US Home Construction) 26.80 a good spot to hold
GLD (Gold Trust) Almost 1/3 of the average daily volume which leads me to think digestion even though it confirmed the warning phase
SLV (Silver) 15.50 now point to hold
GDX (Gold Miners) 25-26 should be next target if holds 21.00
USO (US Oil Fund) 10.80 needs to clear on a closing basis. Held the 10 DMA
OIH (Oil Services) Held the 200 DMA
XOP (Oil and Gas Exploration) Inside day
TAN (Guggenheim Solar Energy) Over 25.20 looks great. 22 the major underlying support
TLT (iShares 20+ Year Treasuries) 127 next point to hold. Last week I tweeted that TBTs looked good with the caveat of a FED meeting.

Every day you'll be prepared to trade with:


