November 27, 2011
Mish's Daily
By Mish Schneider
Will the focus remain on Europe and their sketchy situation? Is it possible with the plethora of economic data due out this week for the US, the market can redirect its emphasis? Can any economic indicators yield end of year optimism?
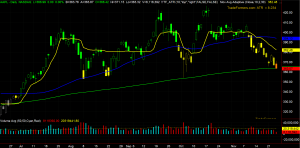
SPY: Daily RSI oversold, weekly approaching and monthly not yet close. 113.75 is the 200 weekly moving average, an area to watch. Otherwise, with the falling knife and a hammer candle last Friday, there are gaps galore, which with a good short covering rally, can be filled.
 QQQ: One gap above 54.73 to 55.30 and 55.75 now overhead resistance. A bit more oversold than SPY on weekly and monthly charts. Would be awfully scary to see this break 50.00. Lots of eyes will be on AAPL at the 200 DMA.
IWM: 65.20 the 200 weekly moving average and closest area to major support. 70.00 the overhead resistance to watch.
ETFs:
GLD 165-167 now an area of resistance which if clears, should bring in some long interest. Otherwise, 155 was the early fall support.
XRT (Retail) 48.70 the weekly moving average. Interesting area. 46.00 next support.
SMH (Semiconductors) 28.50 the monthly moving average. 25.00 the underlying support.
XLF (Financials) Over 11.97 takes it to 12.37 with any good news in this sector.
XLE* (Energy) Will be a major focus as it approaches major weekly and monthly moving averages. This can easily run to 66 and even 68.00 yet still look awful on the daily chart while alleviating the oversold condition.
IBB* (Biotechnology) 95.74 pivotal. Although this sector/group never ran as well as some of the others, it is now holding up a better than most. Support at 95.10.
For more detailed analysis join me, along with hundreds of other subscribers, at Mish's Market Minute and get my daily trade picks, trade alerts, training videos, and exclusive analysis tools. Sign up for Mish's Market Minute now and get a free 2 week trial!

Every day you'll be prepared to trade with: